


The cost accounting analysis is the table view across all cost accounting objects. It shows in one view what the detail managers show per object: totals by cost centre, cost object or cost category, in total and by quarter. Each row shows the reconciliation from primary to secondary postings. This makes it the tool for comparing areas and checking the totals of both views. In older documents it is called “internal cost analysis”.
Open the analysis
Finance → Cost accounting analysisAlternatively, in the Finance menu, click the orange tile Cost accounting analysis in the Cost accounting area (“Totals of the internal cost items by cost centre, cost object and cost category”).
How the analysis is structured
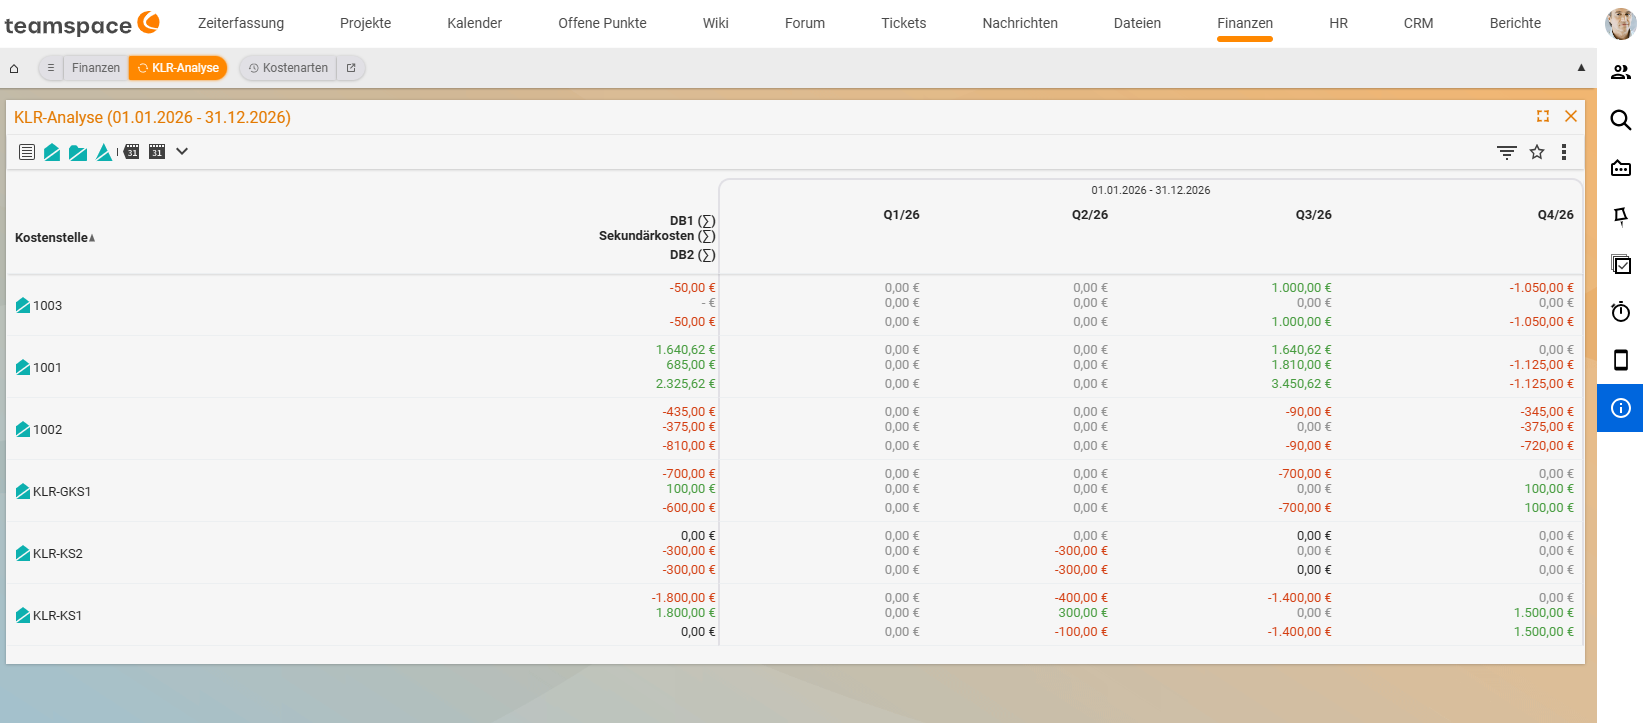
Each row is one object, with three values below each other:
CM1 (∑)                Primary postings
Secondary costs (∑)    Repostings and allocations
CM2 (∑)                Result after distribution
The columns show the total for the selected period (default: the current year) and per quarter (Q1/26 to Q4/26).
Example: The cost centre KLR-KS1 has primary postings of −€1,800 and was relieved by €1,800 through an allocation. The row shows CM1 −€1,800, secondary costs +€1,800 and CM2 €0.00: the service cost centre has been fully distributed.
Switch the view
Use the three icons on the left of the toolbar (cost centre, cost object, cost category) to switch what the rows are based on.
Split and group
Click the list icon on the far left to open the view settings:
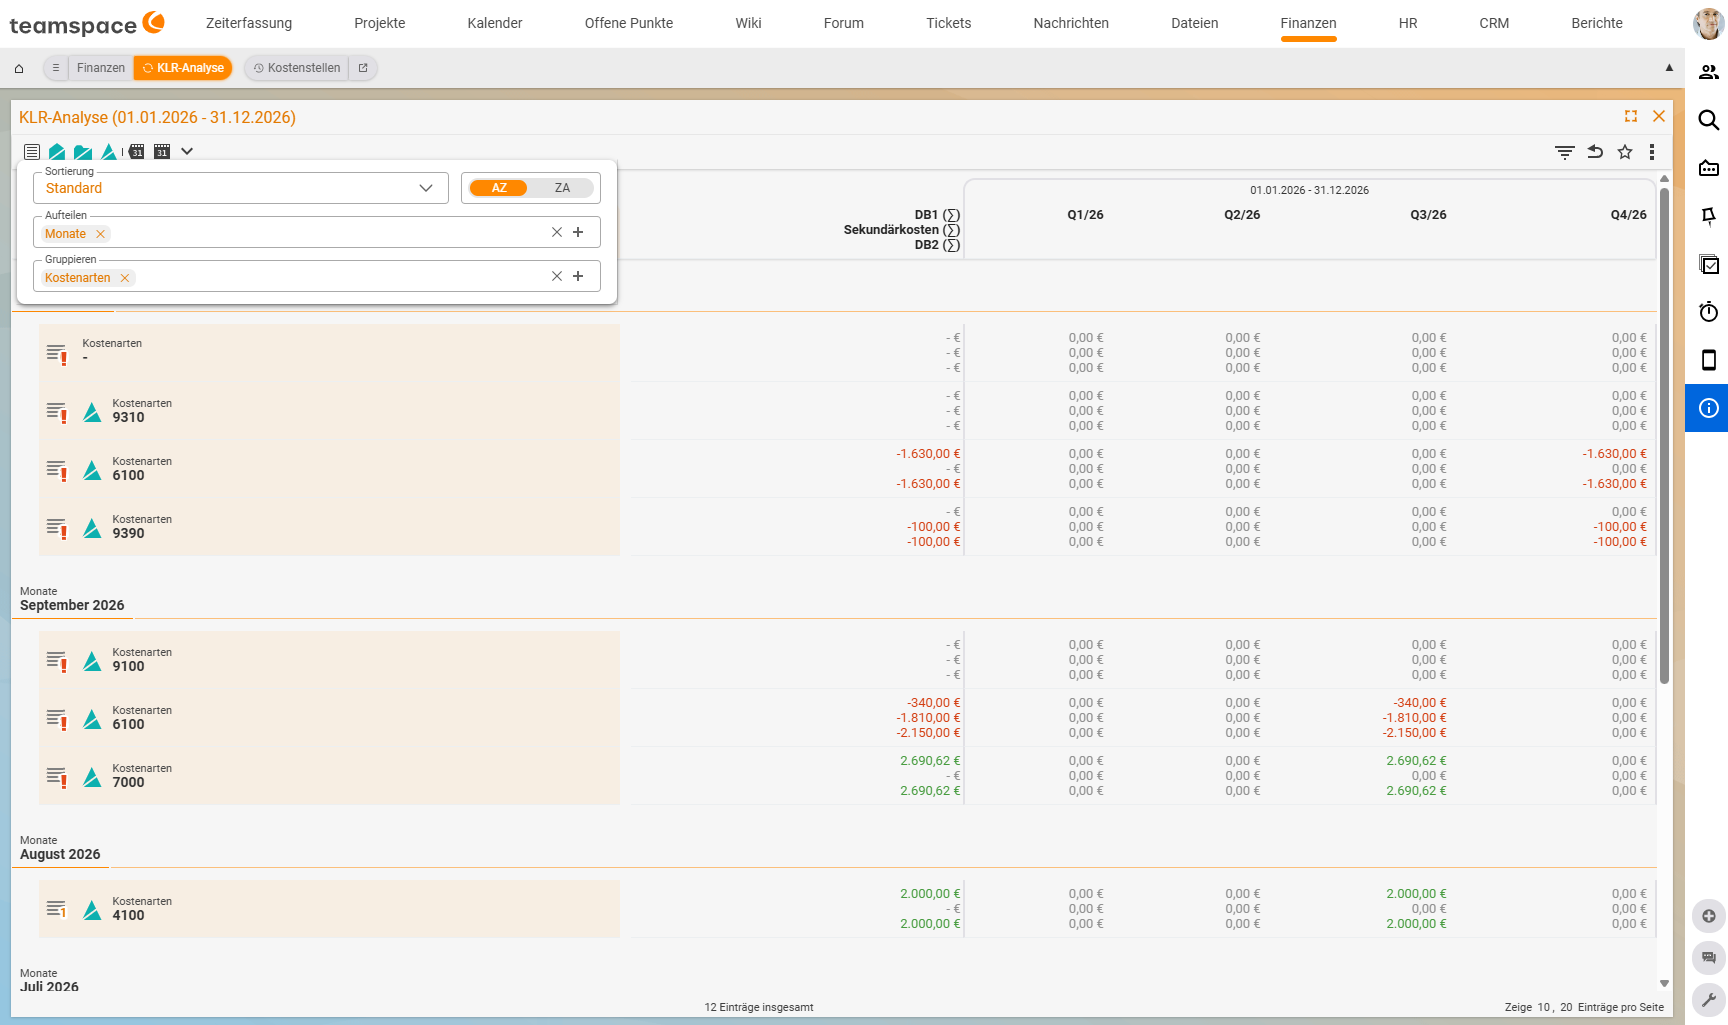
SortingwithAZorZA.Splitbreaks the analysis down into blocks, e.g. byMonths. Each month is then shown as a separate section, one below the other.Groupcombines rows within a block, e.g. byCost categoriesor – in the cost object view – by owner cost centre. This shows you the projects bundled by the area they belong to (see Types and structure).
This is how you answer a question such as “Which cost categories drove costs in September?”.
Choose which rows to show
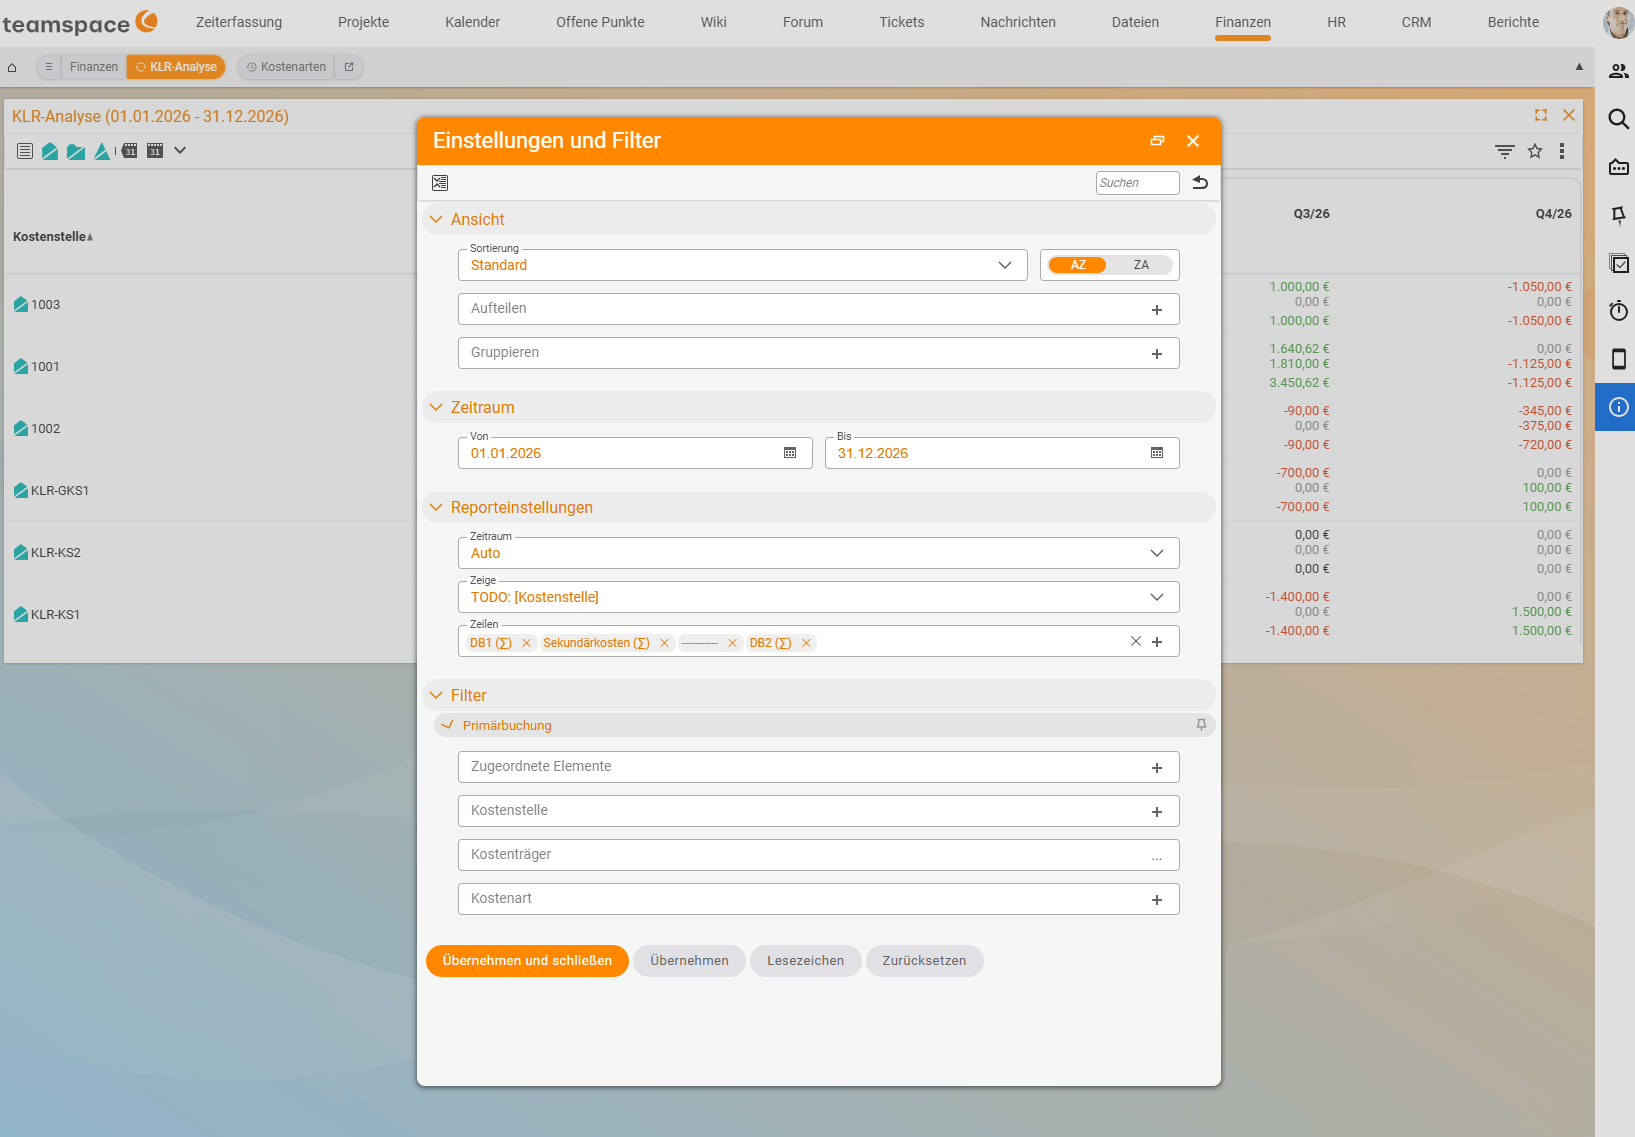
Use the filter icon at the top right to open the Settings and filters dialog. It has four areas:
View: sorting, split and group as above.Period:FromandTo; the default is the current year.Report settings:Period(e.g.Auto), the view underShowand theRows, i.e. which values are listed below each other for each object.Filter: underPrimary posting, the restriction toAssigned elements,Cost centre,Cost objectorCost category.
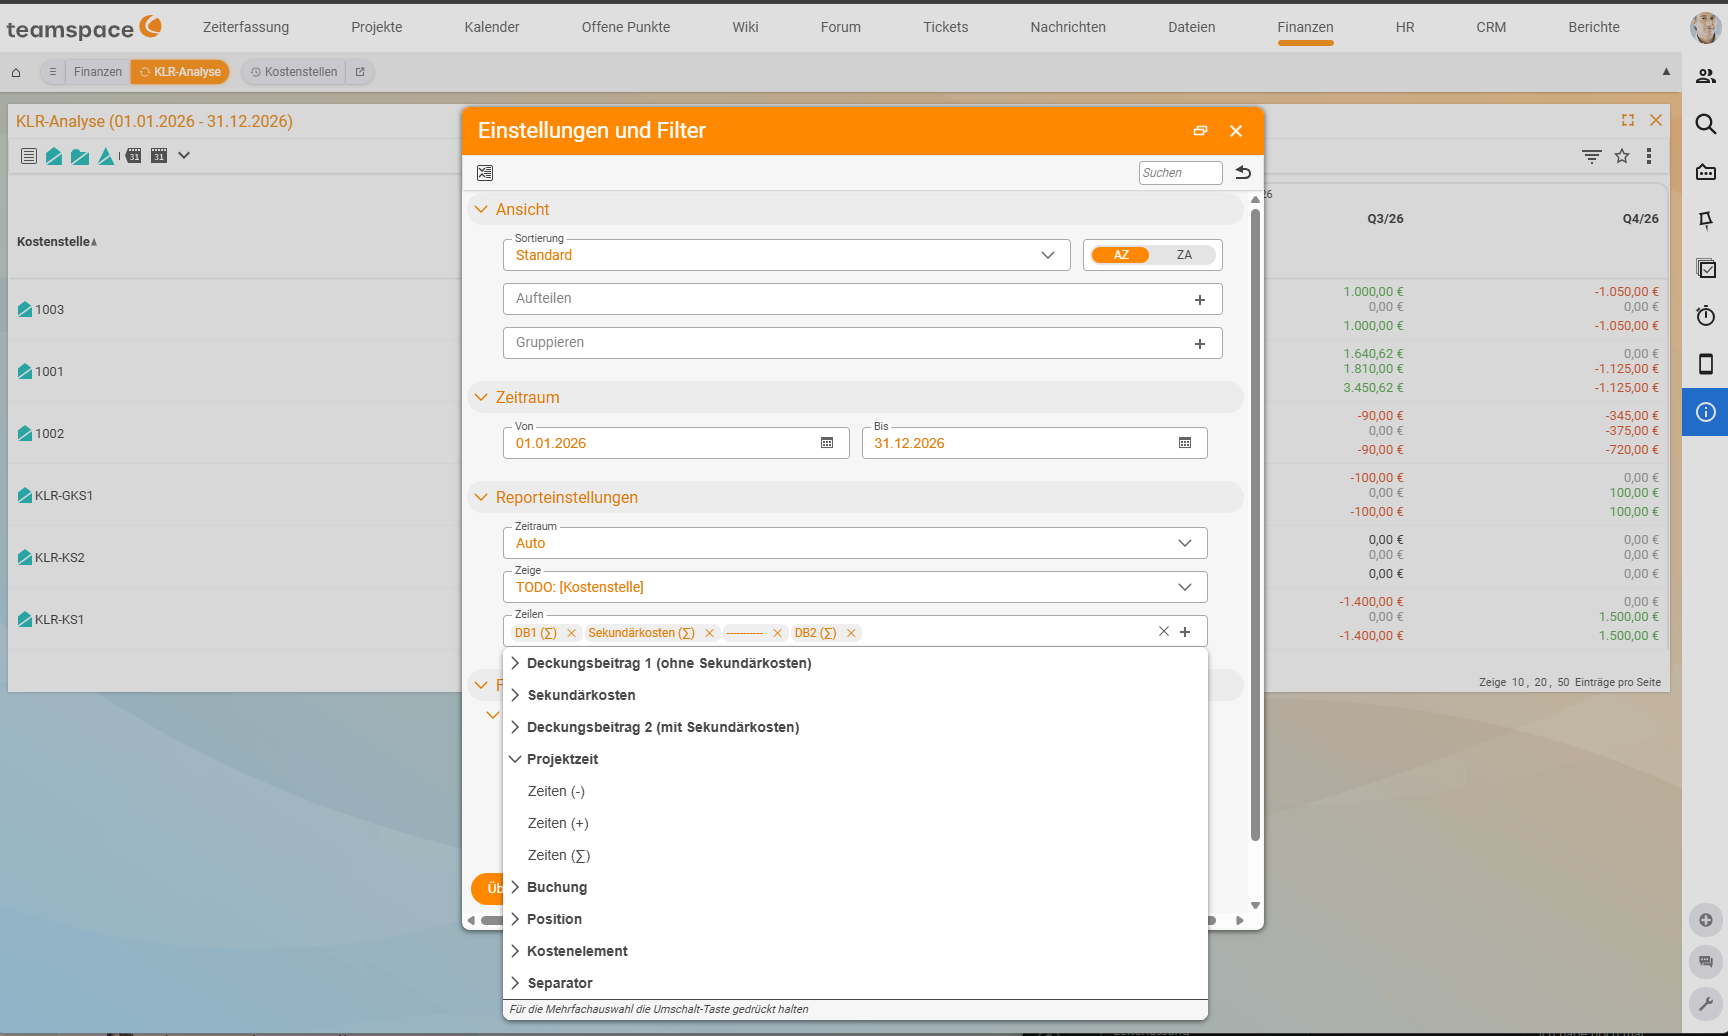
By default, Rows contains CM1 (∑), Secondary costs (∑), a separator line and CM2 (∑). Using the plus, you can show a whole range of further values:
| Group | What it shows |
|---|---|
Contribution margin 1 (excluding secondary costs) | CM1 from the primary postings |
Secondary costs | repostings and allocations |
Contribution margin 2 (including secondary costs) | CM2 after distribution |
Project time | the valued time bookings: Times (-), Times (+), Times (∑) |
Posting | the general postings |
Line item | the line items, i.e. revenue and external services |
Cost element | expenses, commissions, material |
Separator | a separator line between the rows |
Each group offers its values as a negative part (-), a positive part (+) and a total (∑), as shown for Project time. This lets you break down an object’s CM1 into its sources, e.g. times, cost elements and line items one below the other. For multiple selection, hold down the Shift key.
Click Apply and close to apply the settings. Use Bookmark to save an evaluation you need often, and Reset to return to the default.
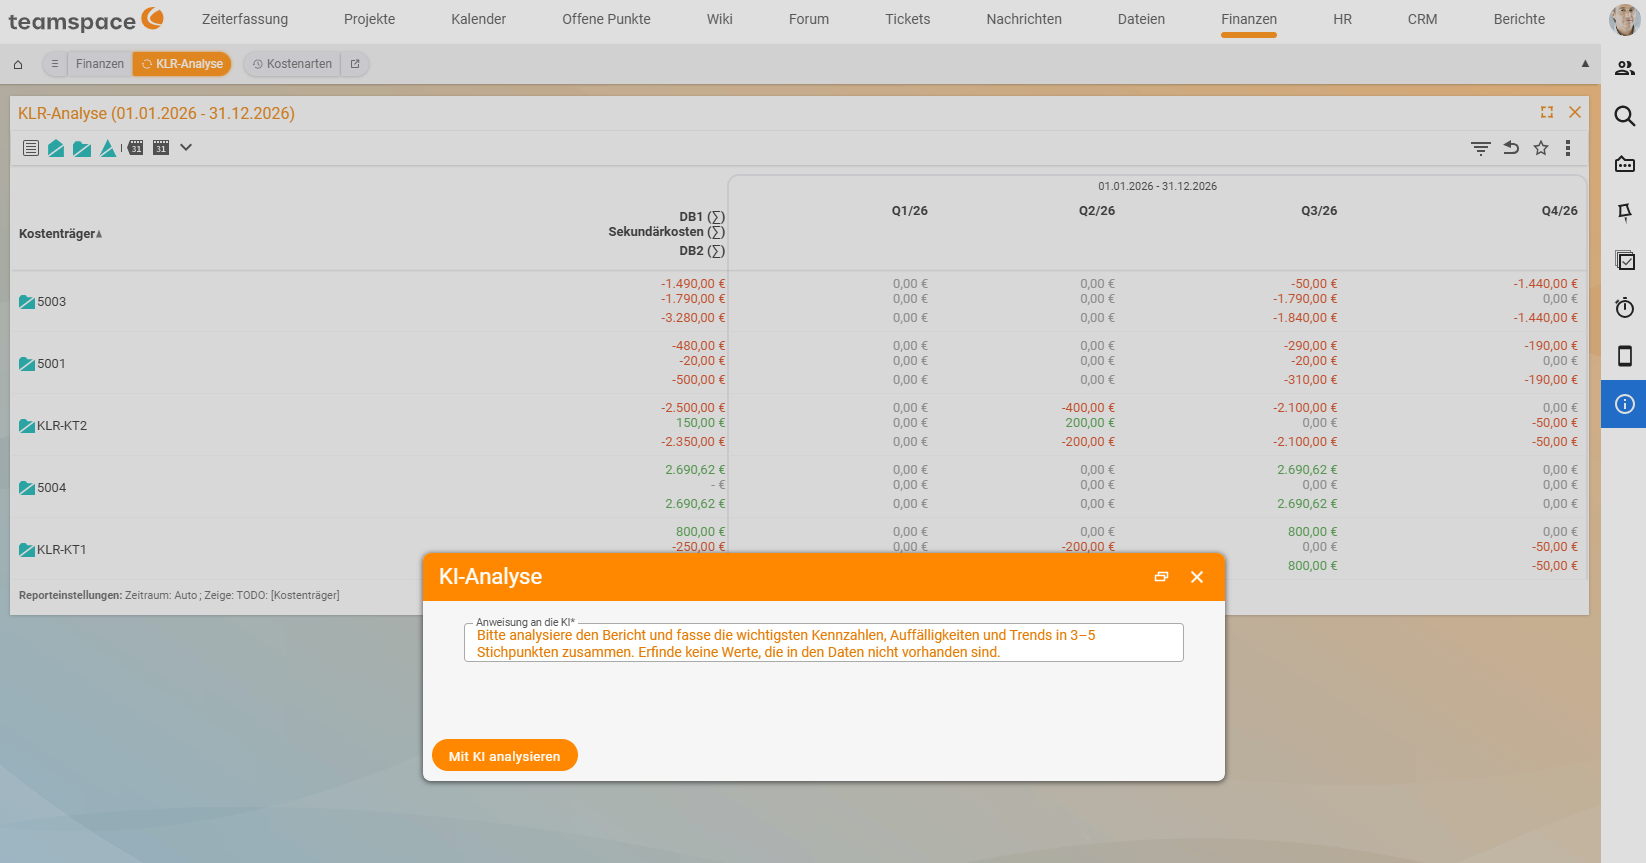
Analyse with AI
You can have the AI summarise the cost accounting analysis. This works in all lists:
Three dots (⋮) at the top right next to the favourites star → Analyse with AIIn the AI analysis dialog, the Instruction to the AI is already pre-filled: the AI summarises the key figures, anomalies and trends in three to five bullet points and does not invent any values. Leave it as it is or write your own question, for example “Which cost centres do not carry their share of the overheads after the allocation?”. Start the analysis with Analyse with AI. The AI only sees the rows and values that the analysis is currently showing, limited by the maximum input length. So set the view, period, rows and filters appropriately beforehand, e.g. only the cost centres of one quarter. More on this in Analyse reports with AI.
Compare areas
- Open
Finance → Cost accounting analysis. - Select the cost centre view for areas, cost object for projects and contracts or cost category for the cost structure.
- For each row, read the CM1 first: what did the object earn or cost on its own?
- Then read the secondary costs: what was added or passed on through repostings and allocations?
- CM2 is the result after distribution. An area with a positive CM1 and a negative CM2 does not carry its share of the overheads.
Cross-check the totals of both views
After every reposting and every allocation run, the cost centre view and the cost object view must show the same true result (see Two views, one result). How to check this:
- Show the analysis by cost centre and add up the CM2 of all rows.
- Show it by cost object and add up the CM2 again.
- Both totals must be equal. Salary cost centres are not counted.
- If the totals differ, look in the movements for a cross-posting from a normal cost centre to a cost object or for a posting that is missing one of the two sides.
Show and filter cost accounting fields in lists
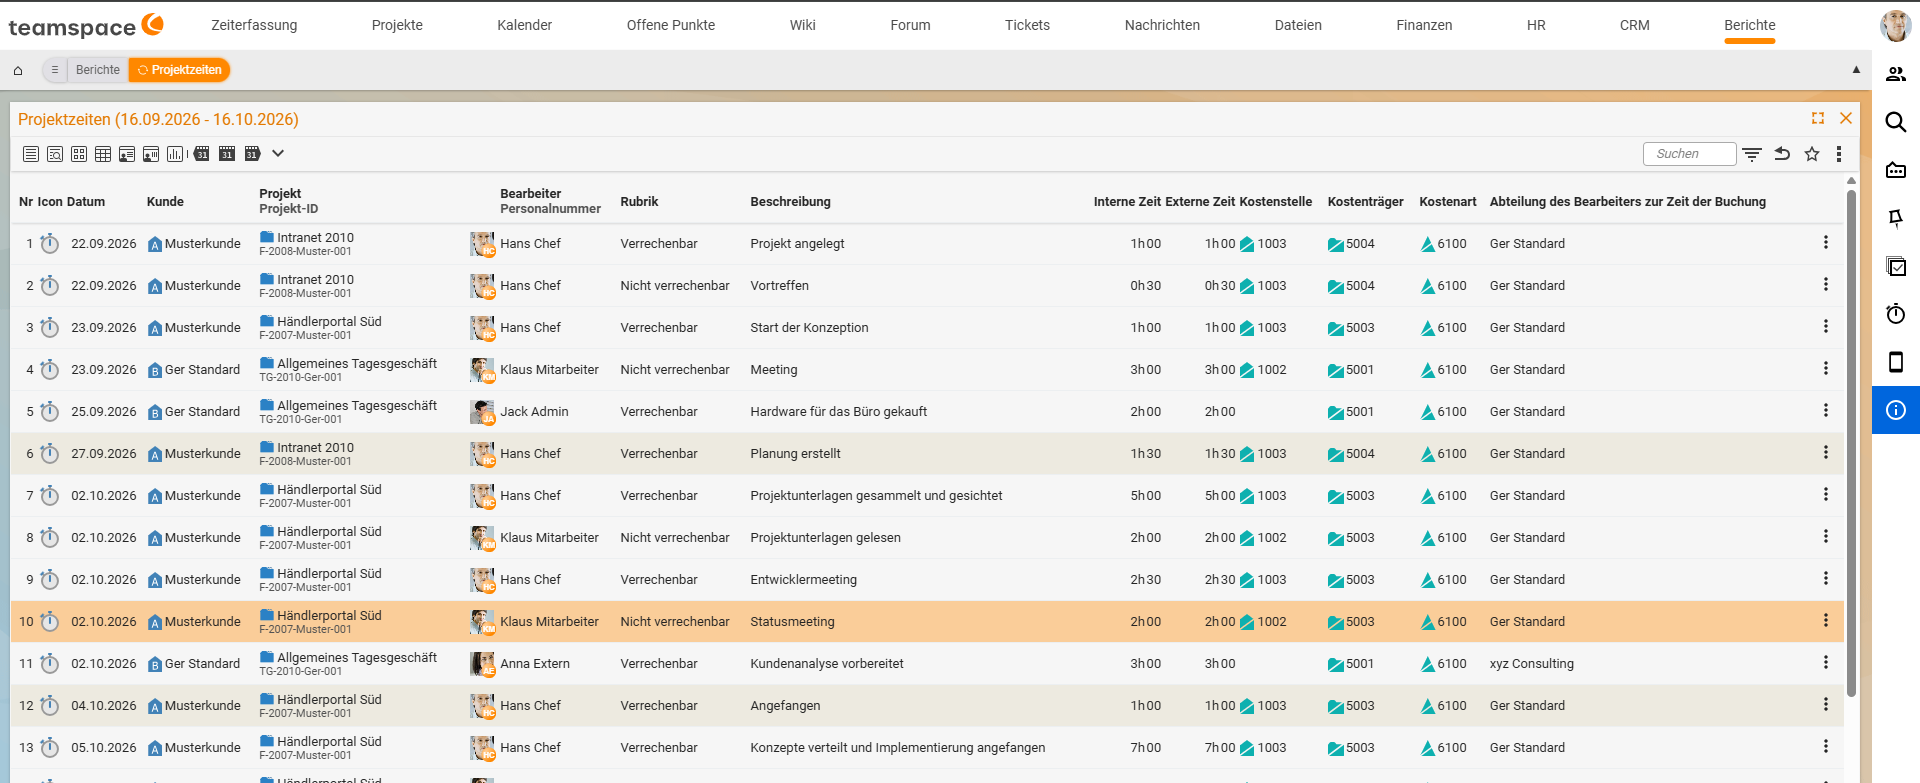
You can also evaluate by cost category, cost centre and cost object in normal lists, for example in the Project times:
- Open the list, e.g.
Reports → Project times. - In the filters, expand the
Cost accountingaccordion. - Show cost category, cost centre and cost object as active columns.
- Filter by the value you want, for example all times on one cost centre.
This lets you find cost drivers or particularly profitable services directly in the list. The project times also have the column Department of the assignee at the time of booking: it shows which department the work came from, even if the employee has since moved. How lists, filters and saved views work in general is described in Working with lists.
What you see and what you do not
The cost accounting analysis only shows rows and totals for the objects you are allowed to see. Counterparts of other objects appear with name and amount but cannot be opened. For a complete cross-check of the totals you therefore need view rights on all cost centres and cost objects.
Common problems
The totals of cost centres and cost objects differ. First check whether you are allowed to see all objects. If you lack rights, rows are missing too. If the rights are fine, there is usually a cross-posting (see Two views, one result).
A service cost centre is not at zero.
The allocation for the period has not run yet, or it ran before a late posting. Check the schedule in the Allocation rule tab and the movements of the cost centre.
The quarters show different values from what you expected.
Allocations and repostings carry their own date. An allocation for September that runs on 2 October appears in the fourth quarter. So read the total over the period or set the Period accordingly.
Common questions & needs
| You want to … | How to |
|---|---|
| See which area does not pay for itself | Cost accounting analysis in the cost centre view: areas with a negative CM2 after the allocation. |
| See the cost structure of a quarter | Cost category view, read the quarter column. |
| Evaluate a specific period only | Settings and filters → Period → From and To. |
| See the costs per month by cost category | View settings: Split by Months, Group by Cost categories. |
| Break CM1 down into times, line items and cost elements | Settings and filters → Rows → add Project time, Line item and Cost element, each with (∑). |
| Reuse an evaluation | Save it via Bookmark in the Settings and filters dialog. |
| Get a summary of the anomalies | Three dots (⋮) at the top right → Analyse with AI. |
| See only certain cost categories | Settings and filters → Filter → Primary posting → Cost category. |
| Check whether the allocations ran correctly | Cross-check the totals of both views; all service cost centres and intermediate cost objects must be at zero. |
| Find all times on a cost centre | Project times → filter accordion Cost accounting → filter by cost centre. |
| Trace a value in detail | Open the object and read the Movements tab in the detail manager: Cost centres, cost objects and cost categories in the detail manager. |
Related topics
- Contribution margin I and II by project, customer and area Cost accounting Concept
- Cost centres, cost objects and cost categories in the detail manager Cost accounting How-to
- Analyse reports with AI AI features How-to
- Project reports Controlling How-to
- Topic: Cost accounting Cost accounting
- Contribution margin accounting with teamspace