


A report delivers figures. The question of what those figures mean, it doesn’t answer – you ask yourself that, usually in your head, often with the Excel export as a detour. The AI analysis shortens this: it reads the report and names what stands out.
How to do it
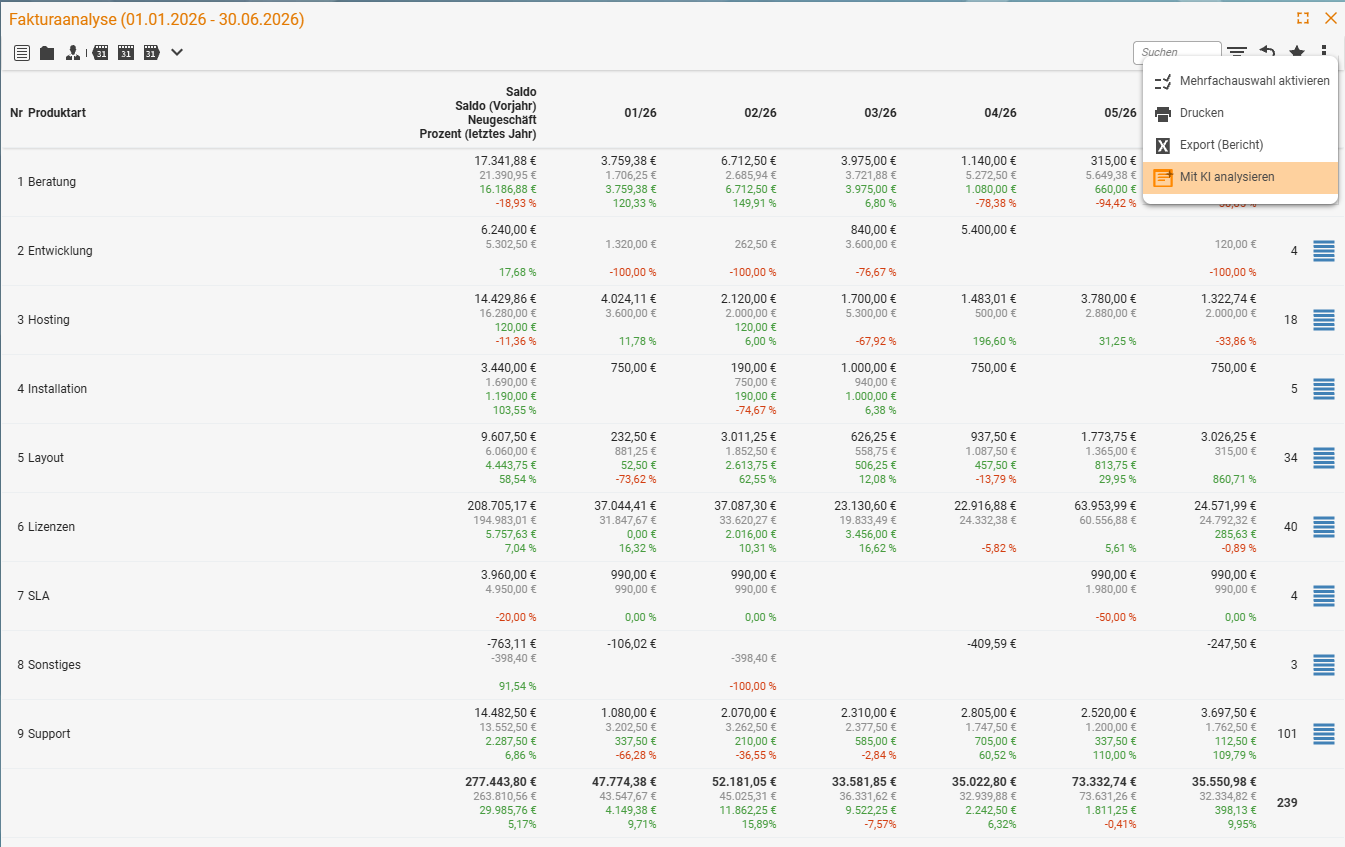
- Open the report or list as usual and set it up the way you need it – period, filter, grouping.
- Click the three-dots menu at the top right, next to the favourites star. This works in every list and report.
- Choose Analyse with AI – the entry sits directly below Export (report).
- In the AI analysis dialog, the instruction to the AI is already pre-filled: the key figures, anomalies and trends in three to five bullet points, without invented values. Keep it or type your own question.
- Click Analyse with AI.
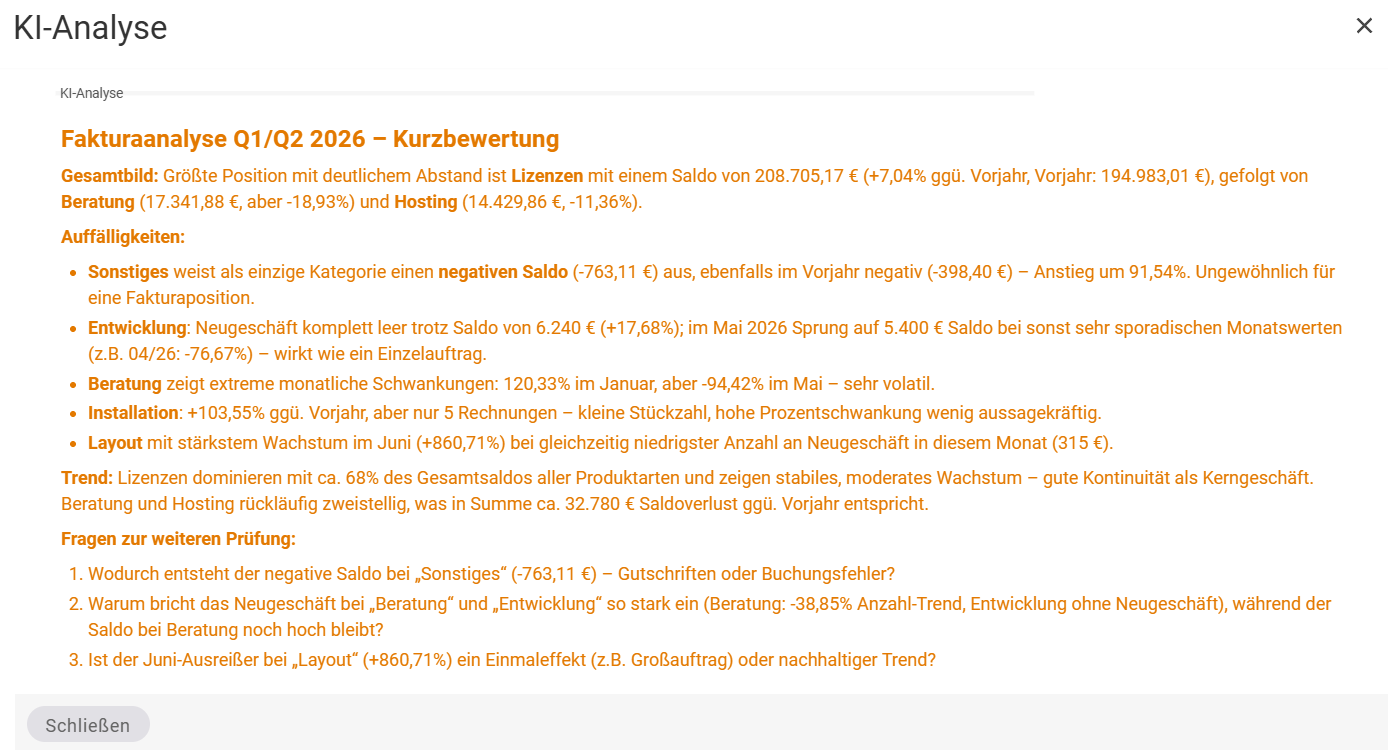
The result appears in the AI analysis dialog above the report. No export, no second tool, no switching.
The analysis thinks along with the report
This is the point that surprises on first use: The analysis is not the same feature with different numbers. It adapts to what kind of report it has in front of it – and delivers completely different insights for an hours statement than for an Invoicing analysis.
| Report | What the analysis thinks about |
|---|---|
| Hours statement | Who booked how much, where it runs out of hand, which activities eat up the time, where plan diverges from actual. |
| Invoicing analysis | How revenue is distributed, which customers carry it, where something drops away, which line items stand out. |
| Project analysis | Where progress stands against the budget, which projects are tipping over, where the contribution margin is thin. |
That’s why it’s worth trying the analysis on different reports instead of testing it once on one and then forgetting it. And that’s why it’s worth setting the report up properly first: the analysis sees exactly the data you currently have displayed – no more. A tight filter gives a narrower but sharper answer.
Ask your own question
The pre-filled instruction gives a general overview. If you have a specific question, type it into the Instruction to the AI field. The AI answers it from the data displayed. Examples:
| Report | Possible instruction |
|---|---|
| Hours statement | ”Which employees booked significantly fewer billable hours than in the previous month?” |
| Invoicing analysis | ”Which three customers show the largest drop in revenue, and by how much?” |
| Cost accounting analysis | ”Which cost centres do not carry their share of the overheads after the allocation?” (see Work with the cost accounting analysis) |
Questions that go beyond the displayed data – for example across several reports or about data the list does not show – are beyond the analysis. That is what MCP is for.
What you do with it
- Before the monthly review. Know the notable points before anyone asks about them.
- As a second pair of eyes. The AI spots the thing that stands out – including the one you wouldn’t have looked for.
- As a starting point. The analysis tells you where it’s worth digging. The digging then happens in the report.
- Instead of the Excel detour. For a “quick look to see if anything stands out”, you no longer need a spreadsheet.
The limits
The analysis is an interpretation, not a calculation. It may emphasise an anomaly that isn’t one, or miss one. What it says is a pointer – the figures in the report are the truth.
It reads only what is there. It knows neither your back story nor the reason January is always weak. If a figure looks the way it does because of an arrangement from 2019, it sees an anomaly.
It phrases things anew each time. The same analysis twice gives two similar but not word-for-word answers. For figures that have to be exact and repeatable, the report is what counts – see Why teamspace relies on rules for AI.
Common questions & needs
| You want to … | How to |
|---|---|
| A sharper analysis | Filter the report more tightly beforehand. The analysis only sees what is displayed. |
| Different insights | Take a different report – the analysis adapts to its kind. |
| To pass the analysis on | Copy the result out. It is text; the report remains the reliable source. |
| To know what it is based on | On the report data currently displayed – limited by the maximum input length (see Connect an AI). |
| A recurring analysis | A report is the right tool for that, not the analysis. It is for a look, not for routine. |
| To ask a specific question of the displayed data | Replace the instruction to the AI in the dialog with your question, e.g. “Which three customers show the largest drop in revenue, and by how much?” |
| To ask questions across several reports or about data not displayed | The analysis can’t do that – for that there is MCP. |
| To use the analysis, but “Analyse with AI” is missing from the menu | No AI is connected, or your user group lacks the right Analyse reports with AI. Ask your administrator (see Connect an AI). |
Notes
- Large reports can be truncated. The maximum input length limits what goes to the AI. With very extensive reports the analysis may not see everything – filtering more tightly helps.
- Only the displayed data and your instruction go out, and only when you call the analysis – see Your AI, your data.
- The analysis changes nothing. It reads but does not write back.
- The report remains authoritative. If the analysis and the figures contradict each other, the figures apply.
Related topics
- Condense a ticket history with AI AI features How-to
- Why teamspace relies on rules for AI AI features Concept
- Connect an AI AI features Configuration
- Topic: Controlling Controlling
- Topic: Key figures Key figures