
All Controlling reports are operated on the same principle. Once you know the mechanics, you can operate every report – whether it’s a finance, project or ticket analysis. This article explains each lever once in detail; the individual report articles refer back to it.
You control how a report looks and which fields it contains via the filter area. For clarity it is divided into sections. You’ll find the View, Period and Filters sections in almost every report; the remaining sections adapt to the specific report.
The five operating elements of every report
1. Quick filters
Quick filters are frequently used filter settings as a click icon directly in the top toolbar. Typical quick filters are period presets such as Last week, Last month, Last year and view switches such as Projects, Assignee, Organisation. One click is enough – you don’t have to open the filter modal.
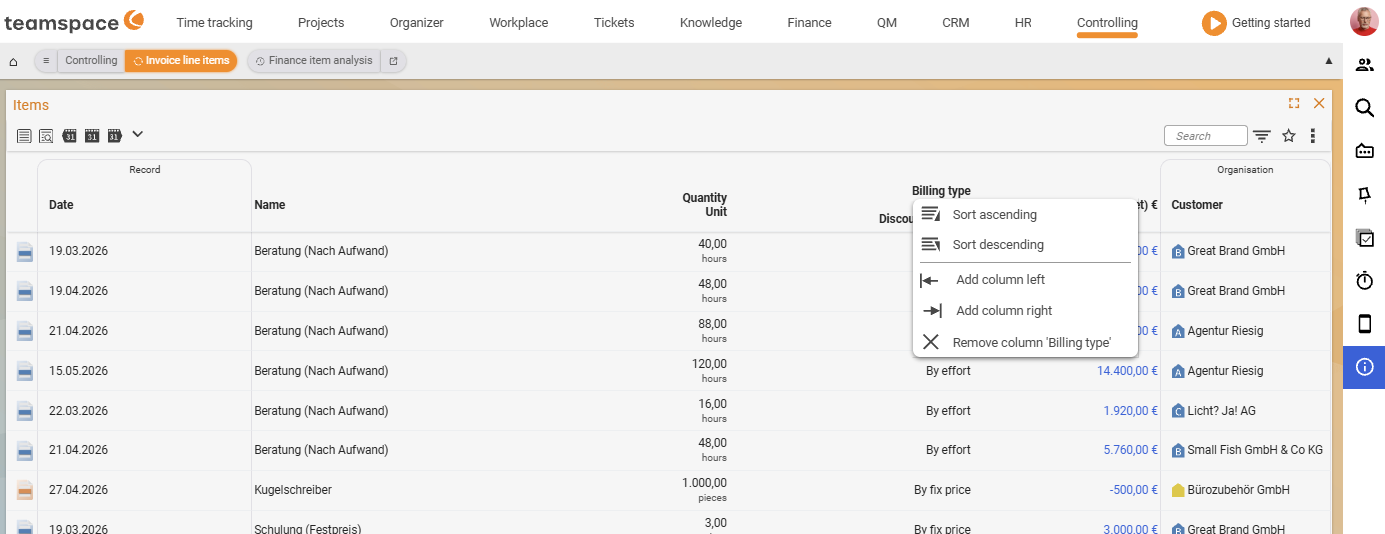
2. Sort by clicking the heading
Clicking a column heading opens a menu with Sort ascending and Sort descending – this is how you set the sort direction. In the same menu you can also add a column to the left or right, or remove the column. A sort marker on the heading then shows the active direction.
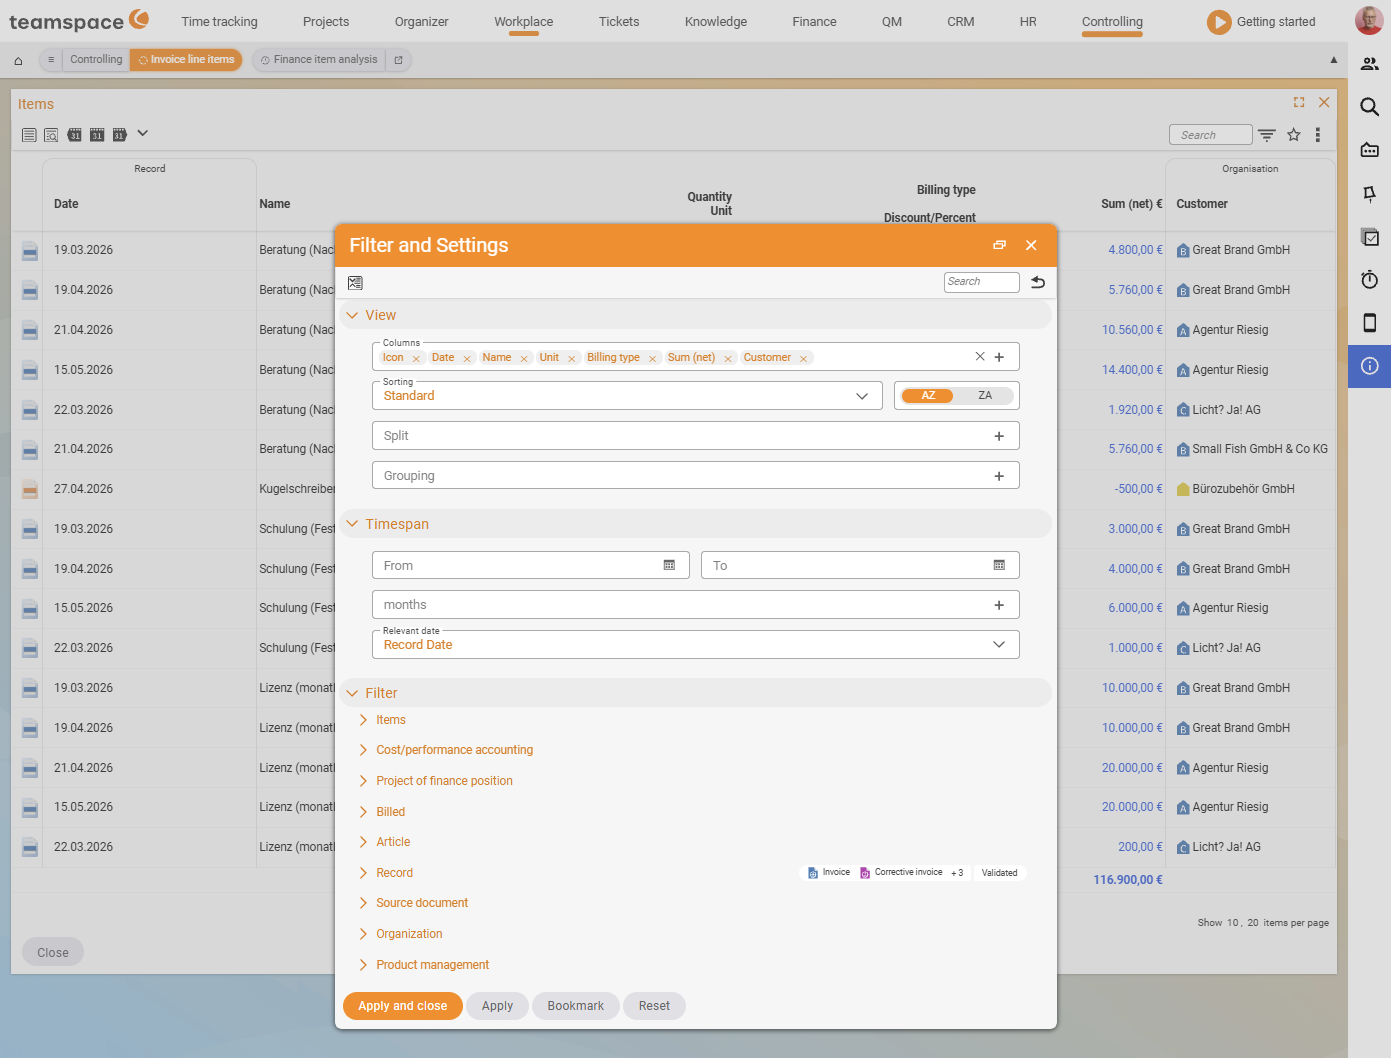
3. The “Settings and filters” modal
Via the filter icon at the top right you open the Settings and filters modal. This is where the actual control sits:
- Columns – choose which columns appear; with
✕you remove a column from the set. Split– splits the report by a criterion; for each split a separate sub-list is shown with the criterion as its heading (e.g. by document, project, customer, date or area).Show(in cumulative analyses) – sets the aggregation basis, i.e. what things are summarised by: customers, assignees, projects, project types or further areas.Period– from/to date picker; filters by the period in which the data arose.- Filter accordions – the report-specific filters (e.g.
Project time,Employee,Project,Billing,Assignments).
At the bottom of the modal sit the buttons Apply and close, Apply, Bookmark and Reset.
4. Report settings
Many analyses additionally have report settings: here you decide which values are calculated and displayed – for example whether revenue appears as booked or planned values, whether actual data or planned data is used, whether graphical elements and the number of bookings are shown. Which report settings exist depends on the report and is stated in each report article.
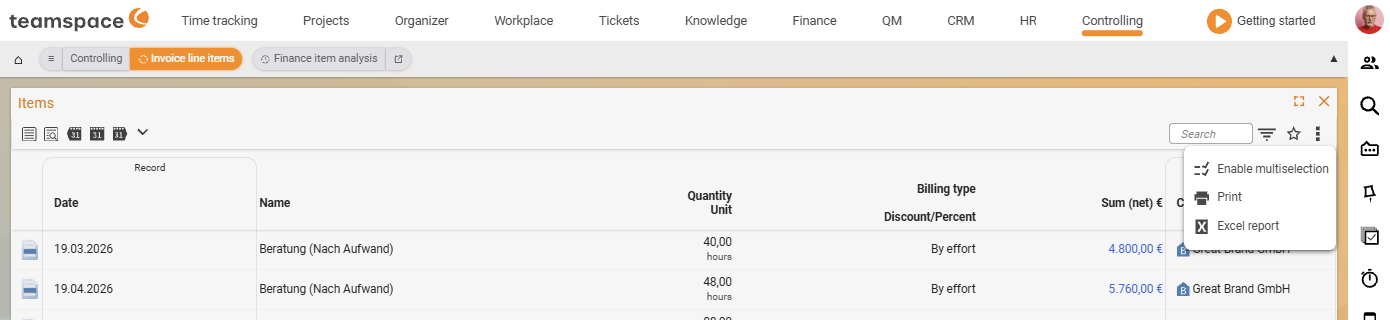
5. Print, Excel export and bookmarks
- Print / Excel report – via the
Actionsthree-dots menu at the top right. Via the export settings you decide, for example, whether time units appear in the export in minutes, hours or days. - Bookmark – the star icon at the top right saves your current filter and column selection as the default for this report. This way the report opens next time exactly as you need it.
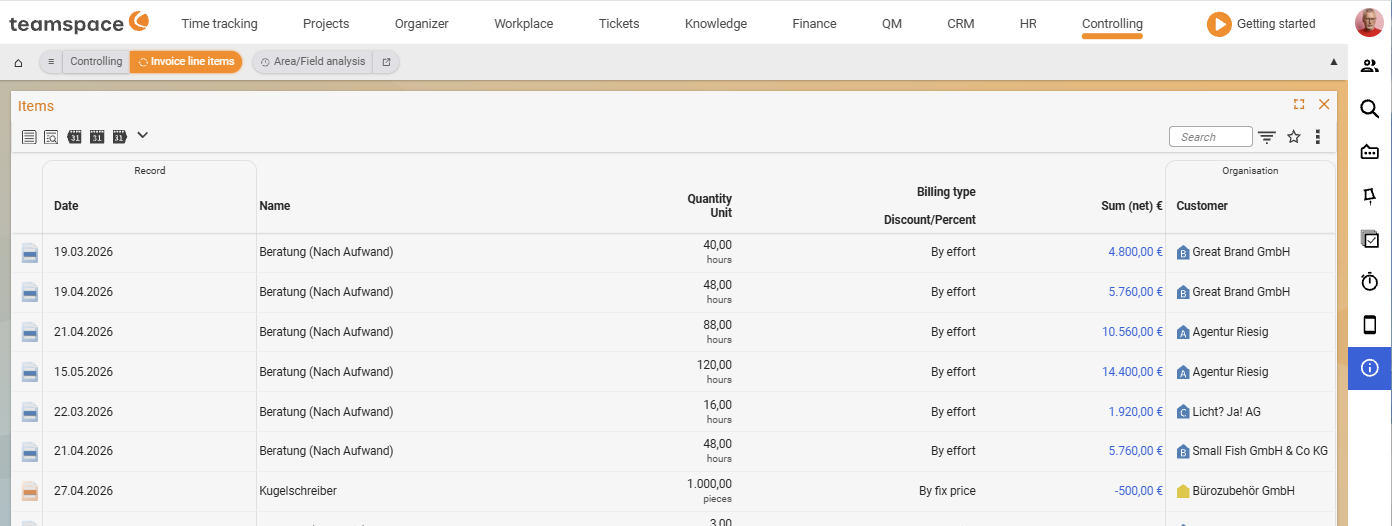
Drill-down: from the figure to its origin
The drill-down function shows where a figure comes from. Typically you click the drill-down icon (or the row) – and the detail list behind the cumulative figure opens. This way you jump, for example:
- from the Invoicing analysis into the individual Invoice line items,
- from the Activity analysis into the individual Activities,
- from the Ticket analysis into the Ticket report.
This way you first analyse cumulatively (how much? how many?) and then fetch the documents/activities behind the value.
Detail list or cumulative analysis?
The reports usually come as a pair: a detail list (every booking/item individually) and a cumulative analysis (totals over time). Examples: Project times (list) ↔ Project time analysis (cumulative), Invoice line items (list) ↔ Invoicing analysis (cumulative), Activities (list) ↔ Activity analysis (cumulative), Ticket report (list) ↔ Ticket analysis (cumulative). For the question “how much in total?” you use the analysis, for “which individual items?” the list – connected via drill-down.
Common questions & needs
| You want to … | How to |
|---|---|
| Quickly restrict to the last month | Click the Last month quick filter in the top toolbar – no filter modal needed. |
| Structure the report by project/customer | In the filter modal, set the Split field; for each value a separate sub-list with a heading is created. |
| Summarise by assignee instead of project | In an analysis, set the Show field (aggregation basis) to Assignee. |
| Hide a column | In the filter modal, remove the column from the set with ✕. |
| See planned instead of booked values | In the report settings, switch the relevant planned/actual-data option. |
| See which documents lie behind a total | Click the drill-down icon on the row – the detail list opens. |
| Pass on the result | Export via Actions → Excel report, or Print. |
| Keep the report just as it is | Click the star icon (Bookmark) – filters and columns are saved as the default. |
| Discard all settings | In the filter modal, click Reset. |
Related topics
- Controlling – introduction Controlling Introduction
- Financial reports Controlling How-to
- Project reports Controlling How-to
- Report overview (reference table) Controlling Reference