
The financial reports show what comes in and goes out. Six reports cover this: Finance analysis as a broad overview with a balance table, Invoice line items and Invoicing analysis for the revenue detail view and the time series, Future revenue as a preview, Post-calculation for the comparison of order ↔ actual revenue, plus Cost analysis and Cost items on the cost side.
All reports share the same operating concept (quick filters, filter modal, report settings, drill-down, export). It is explained once in Working with reports: filter and export – this article is about the specifics of each report.
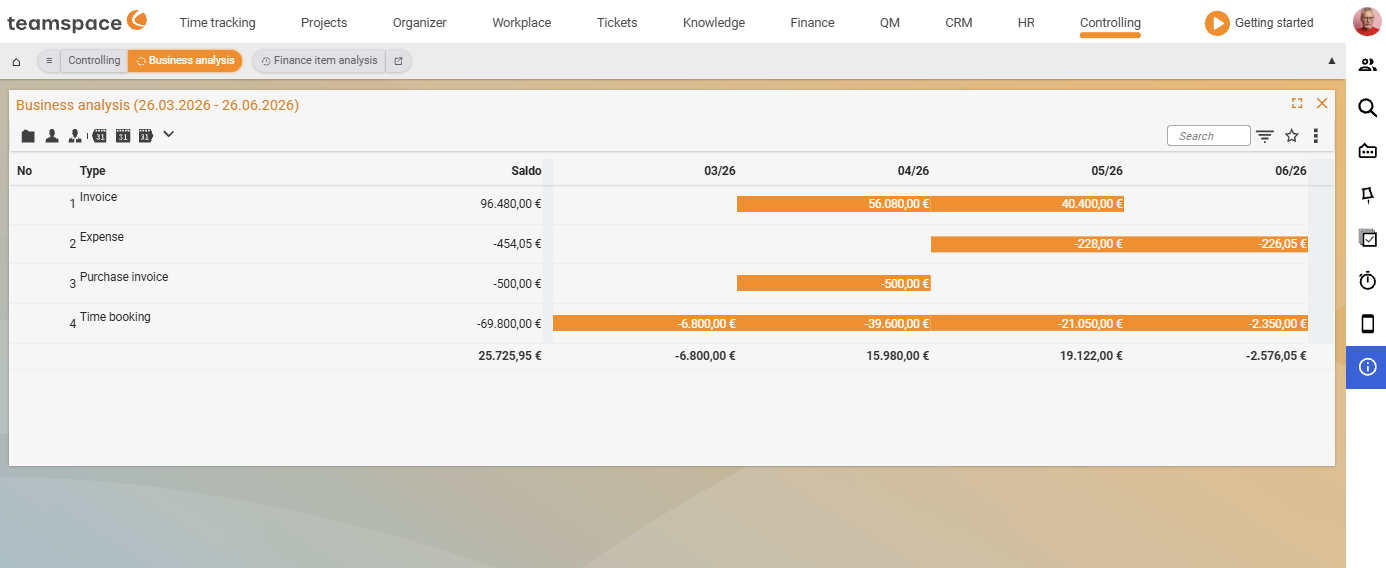
Finance analysis
The Finance analysis is the comprehensive analysis of your financial data. Via many filters you adjust what is calculated and displayed.
Typical questions it answers:
- The contribution margins of projects from the first quarter of the year.
- Which customer brought the most revenue in the quarter?
- What share does new-customer business have in revenue?
The table breaks the financial data down by type. The type rows correspond to the booking sources: Expense invoice, Invoice, Project time, Cost element. Columns are No., Type, Balance and monthly columns such as 02/26, 03/26, 04/26, 05/26.
Via the filters you control period and split. Via the report settings you decide which criteria are used to calculate the result – times, documents, costs or bookings.
Invoice line items
The Invoice line items report is a detailed list of all individual revenue items. It shows every item and is also called as a drill-down target from the Invoicing analysis – this way you see, for example, the invoice line items of a particular period.
A compact view and a detailed view are available – via the checkboxes you decide what is shown. Columns of the list are Document date, Name, Quantity, Unit, Billing method, Discount/Percentage, Total (net) and Customer organisation.
Via the Split field you break the report down by document, project or customer. The filters let you focus on particular projects, customers or types.
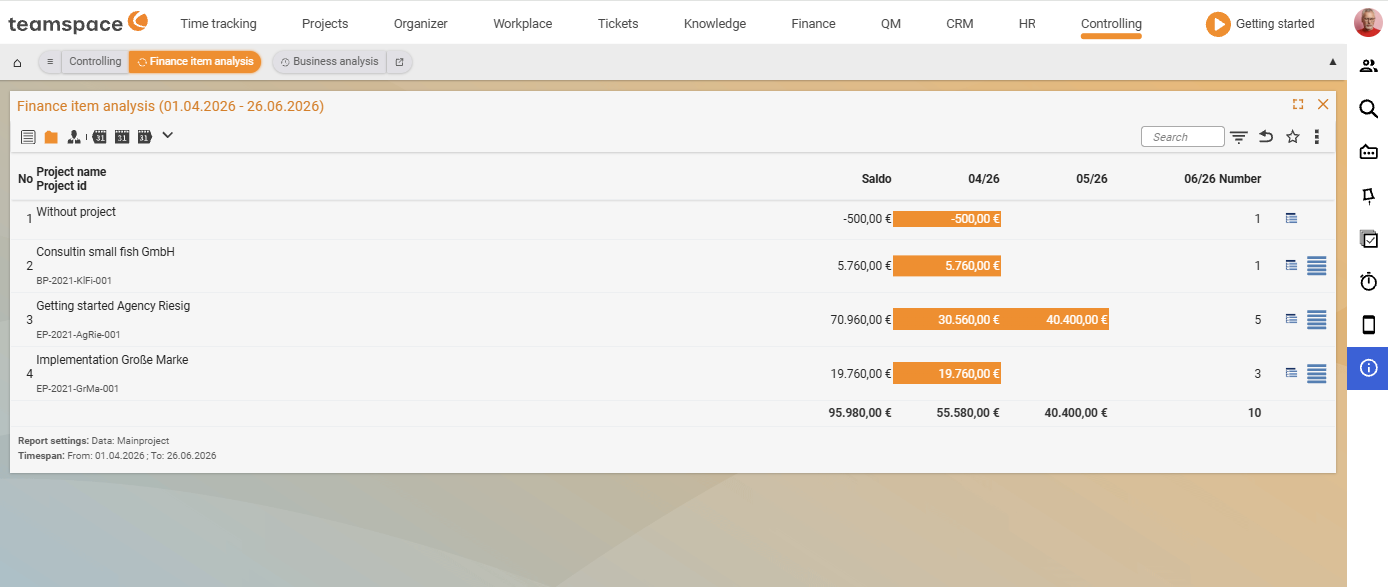
Invoicing analysis
The Invoicing analysis gives you a clear overview of the revenue and expenses of projects and customers. It is a cumulative analysis over time – across days, weeks or months.
Examples from practice:
- Total revenue and expenses of the last two months per project.
- Revenue and expenses distributed across customers over a monthly period.
- Monthly revenue per project or per customer.
The columns are No., the chosen summary criterion (the second column carries the name of the aggregation basis, e.g. Contractor, Customer or Project), Balance, monthly columns such as 04/26, 05/26, 06/26 plus a Count column. If there is no data in the chosen time range, the table shows: No data found. Please check the search settings.
In the filter modal you decide:
Show– aggregation basis: customers, assignees, projects or further areas.- Report settings – which fields appear:
- Revenue: booked revenue, otherwise planned revenue.
- Expenses: actual data, otherwise planned data.
- Balance: actual data, otherwise planned data.
- Graphical elements for a better overview.
- Number of bookings.
By clicking the drill-down icon on a row you jump into the individual Invoice line items behind the value – also split by projects.
Future revenue
With Future revenue you see what is expected in a particular period. Via filters and report settings you decide which factors are taken into account.
Three general views are available:
- Future revenue of the internal departments.
- Future revenue broken down by customers.
- Detailed view of future revenue.
The columns are No., Project name (second line Project ID), Total, monthly columns such as 04/26, 05/26, 06/26 and a Count column. Grouping is typically by Customer: <Name>.
In the filter modal you control which sources feed into the forecast – the filter options are Order confirmations, Open order items (duration), Payment plan, Open order items (fixed) and Apply billing rules. Via Split you break things down, e.g. by Customer; via Show you set the aggregation basis (e.g. Document).
The period (e.g. Monthly, based on the Delivery date) indicates the range in which the future revenue should lie; in addition you filter, for example, by projects or customers.
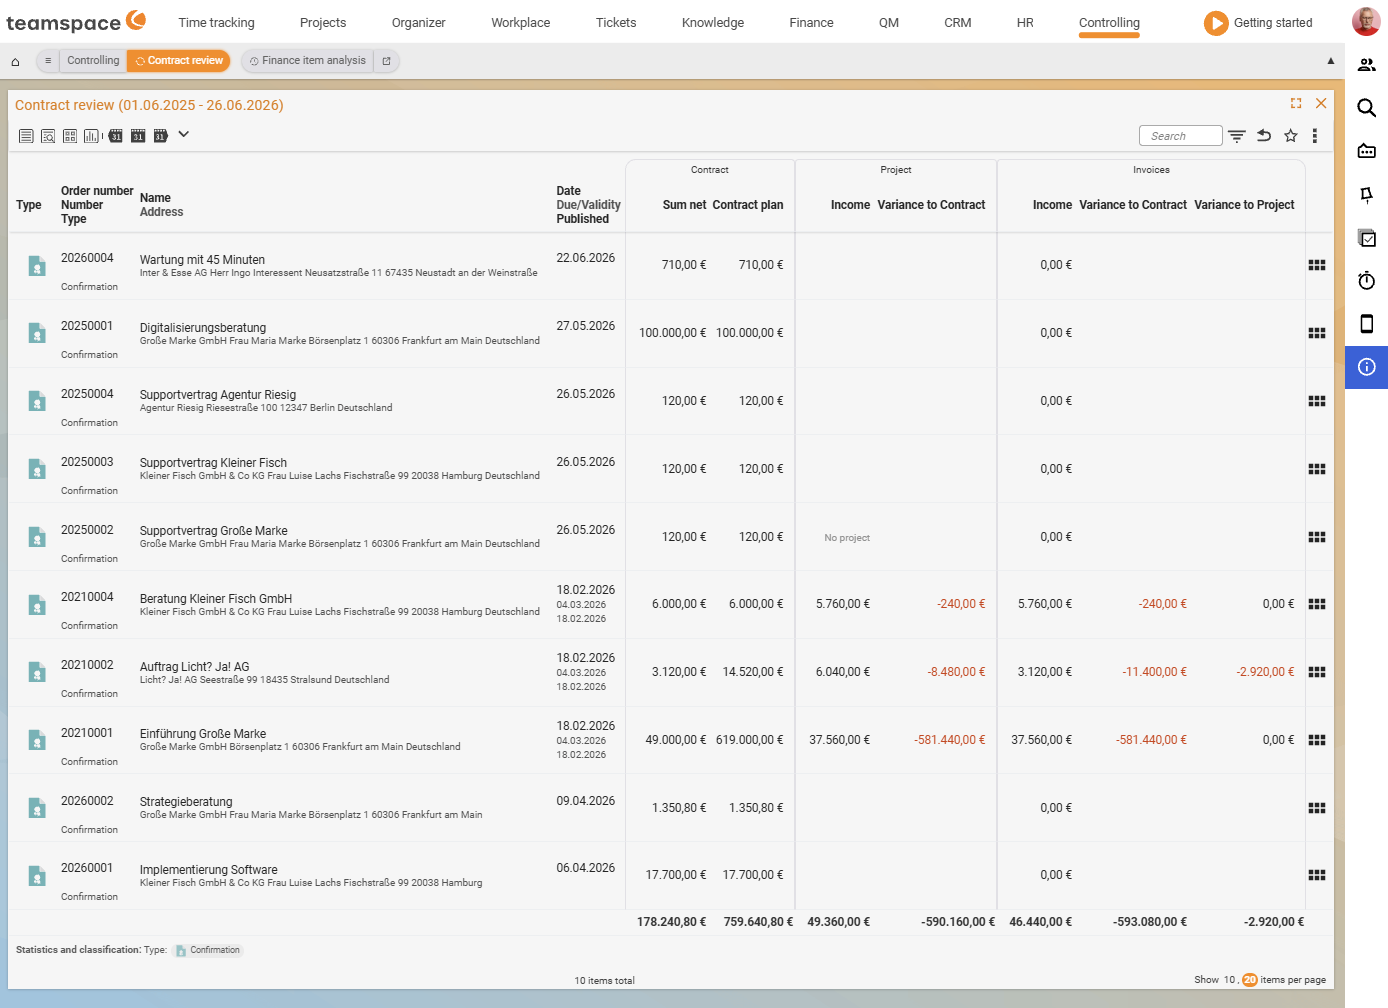
Post-calculation
The Post-calculation compares the planned revenue of an order with the actual revenue. For each order, teamspace checks whether an associated project exists. If so, the project revenue based on recorded times and costs is included – plus the variance to the original order.
In addition, the invoices for the order are taken into account: the revenue from invoices already issued plus the variances to the order and to the project. The columns have a multi-line header with three top-level groups Order, Project and Invoices: for the document identity Type, Order number, Number, Document name, Address as well as Date, Due date/Validity, Published; under Order the values Net total and Order planned value; under Project the values Revenue and Variance to order; under Invoices the values Revenue, Variance to order and Variance to project.
This way, when an order is closed, you recognise whether the real revenue matches the planned revenue – excess or shortfall in revenue.
Cost analysis and Cost items
On the cost side, two separate tiles sit in the module: Cost analysis (cumulative analysis over time) and Cost items (detail list of the individual costs). They analyse travel costs, expenses, commissions and other material and follow the same list/analysis-pair principle as Invoice line items ↔ Invoicing analysis.
Cost items list every cost item individually, with columns in the Billing and Documents groups – including No., Scanned document, Date, Number, Expense type, Description, Costs, Project, Customer, Employee, Invoice, Travel expense report, Employee payroll and Status (e.g. To review). The Cost analysis summarises cumulatively; its columns are No., the chosen aggregation criterion (second column, e.g. Agent), Relevant amount, monthly columns and a Count column.
Note: How costs are allocated to cost category, cost centre and cost object is explained in Cost accounting (KLR).
Common questions & needs
| You want to … | How to |
|---|---|
| See the contribution margin of projects in the quarter | Finance analysis, period to the quarter, report setting to the desired result criteria (times/documents/costs/bookings). |
| Find the customer with the highest revenue | Finance analysis or Invoicing analysis, Show = customers, sort by Balance. |
| See every individual revenue item of a period | Invoice line items, set the period; or via drill-down from the Invoicing analysis. |
| See monthly revenue per project | Invoicing analysis, Show = projects, period monthly. |
| See expected revenue of the coming months | Future revenue, activate the desired report settings (e.g. billable times, open order items). |
| Check whether an order was closed profitably | Post-calculation – read off the variance to the order and to the order/project. |
| Analyse travel costs/expenses | Cost analysis (cumulative) or Cost items (detail). |
Related topics
- Working with reports: filter and export Controlling How-to
- Project reports Controlling How-to
- Cost accounting (KLR) Controlling Concept
- Topic: Invoicing Invoicing
- Cost accounting