
In Controlling you analyse what happens in teamspace: booked times, revenue and expenses, cost items, orders, sales opportunities, tickets and activities. Every report opens as a table with quick filters and a filter modal. You choose the period, the split and the columns, sort by clicking the heading and export the result to Excel.
What makes it special: the reports are not isolated by topic but draw on data created in other modules – project times from time tracking, invoices from Invoicing, sales opportunities from the CRM, tickets from the service desk. Controlling is the shared analytics layer across all of this data.
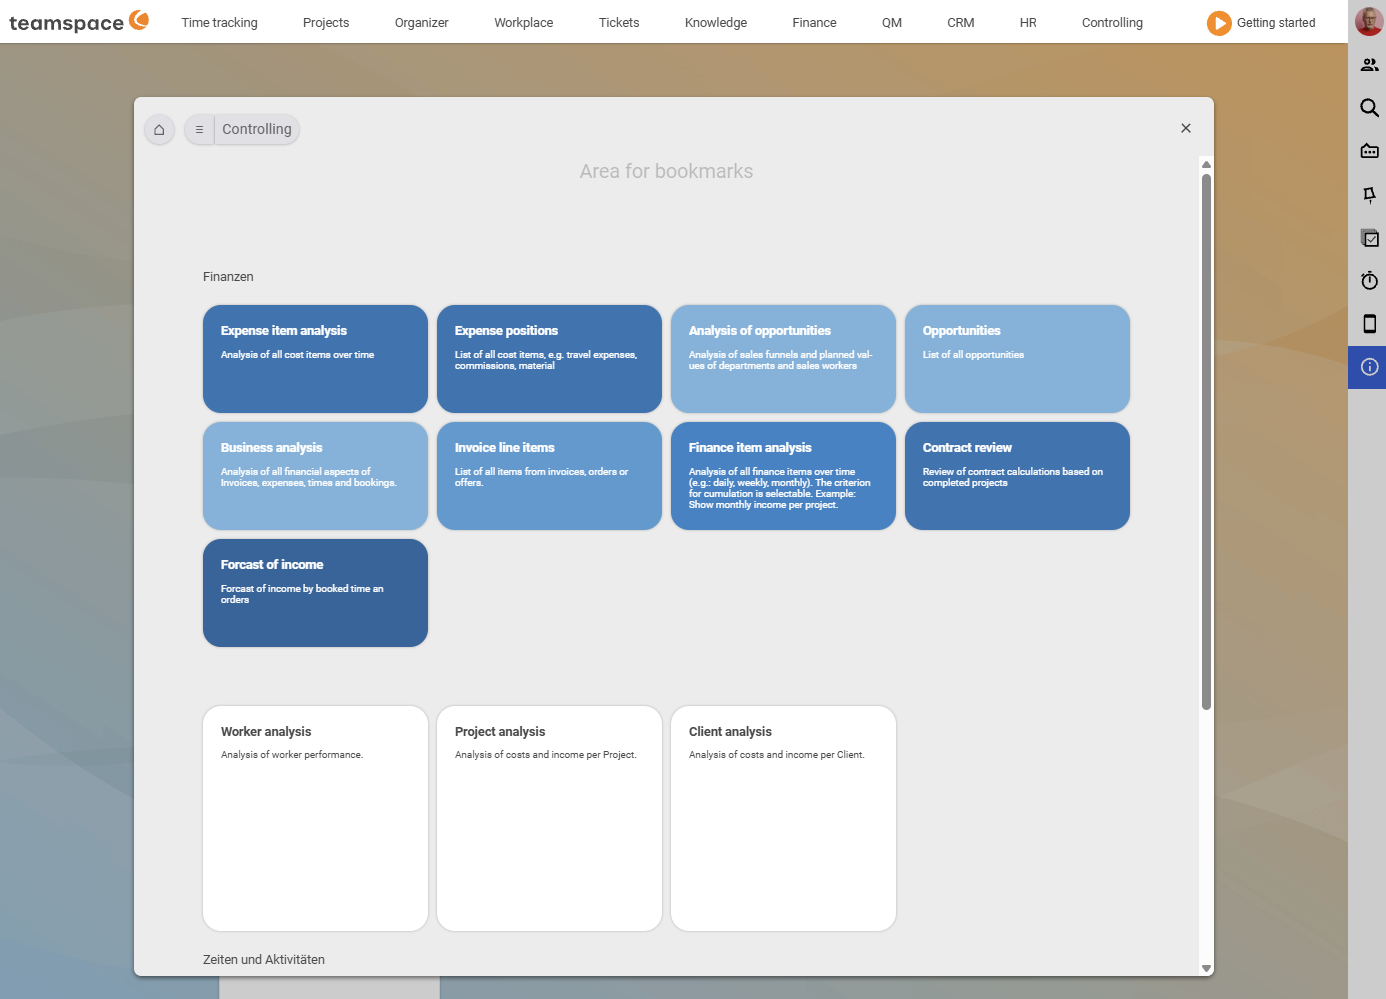
Where the reports sit
You open the module via Controlling in the top bar. The Bookmarks area modal shows all reports as tiles, arranged in blocks:
- Finance: Cost analysis, Cost items, Sales opportunity analysis, Sales opportunities, Finance analysis, Invoice line items, Invoicing analysis, Post-calculation, Future revenue.
- An unnamed block directly below it with the three analysis reports Employee analysis, Project analysis and Customer analysis.
- Times and activities: Project times, Project time analysis, Area/category analysis, Capacity analysis, Working time analysis, Working days, Attendance times, Activities, Activity analysis.
A click on a tile opens the report in the detail area. At the top sits the familiar row of tabs – from there you switch between reports in one step, without returning to the modal.
Note: This is how the reports sit in our demo tenant. The menu in teamspace is fully configurable – in your installation the reports may sit elsewhere or under a menu item of their own. Some of the older reports (e.g. Employee analysis, Customer analysis, Ticket reports) appear, depending on edition, directly in the respective module rather than as a separate Controlling tile – the relevant articles point this out.
How to operate every report
All reports follow the same operating concept. Five things recur:
- Quick filters – frequently used filter settings as a click icon directly in the top toolbar, for example period presets such as
Last week,Last month,Last year, or view switches such asProjects,Assignee,Organisation. - Clicking the headings sorts the column; a sort marker shows the direction.
- The
Settings and filtersfilter modal (filter icon, top right) for column selection,Split,Periodand the report-specific filters. - Print and Excel export via the
Actionsthree-dots menu. - Bookmark (star icon) saves your filter and column selection as the default.
The full operation – with all fields, the drill-down and the export – is described in Working with reports: filter and export.
The report groups at a glance
So that you quickly find the right report, the reports are arranged into five groups. Each group has its own article:
- Financial reports – what comes in and goes out: Finance analysis, Invoicing analysis, Invoice line items, Future revenue, Post-calculation, Cost analysis/Cost items.
- Project reports – what has been worked on in projects and how they stand financially: Project times, Project time analysis, Project analysis, Project status analysis.
- Employee reports – working time, utilisation and the contribution of employees: Working time analysis, Working days, Capacity analysis, Employee analysis, Commissions, Leave.
- CRM & sales reports – pipeline and customers: Sales opportunity analysis, Sales opportunities, CRM analysis, Customer analysis, Activity analysis.
- Ticket reports – analysing your tickets: Ticket report, Ticket analysis.
Cutting across these are the Other reports (Area/category analysis, Ad-hoc report). If you prefer to look things up, you’ll find every report with its data source and typical question in the Report overview.
Three cross-connections you need to know
Because the reports compute on data from other modules, there are three adjustments outside the Controlling module that make many analyses correct in the first place:
- The internal cost rate per employee drives the contribution-margin calculation in the Project, Employee and Customer analysis. You maintain it per period in the HR portal.
- You set commission rates per category in the configuration under Projects → Categories.
- Ad-hoc reports (automatic email dispatch) are configured in your personal settings under
Personal data – Notifications, not in the Controlling module.
How to set up these three things is described in Set up cost rates, commissions & ad-hoc reports.
If you want the bigger picture
There are methods behind the figures. Why planned/actual comparison, earned value analysis, the traffic-light method and contribution margin are meaningful is explained in Project controlling methods. If you want to allocate costs cleanly to cost category, cost centre and cost object, you’ll find the model in Cost accounting (KLR).
Related topics
- Working with reports: filter and export Controlling How-to
- Report overview (reference table) Controlling Reference
- Topic: Project management Project management
- Topic: Invoicing Invoicing
- Project controlling software