
Anyone steering projects wants to know whether they are on plan and making money. teamspace delivers the key figures right where the data arises – without an Excel export. This article shows where to find which figure and when the topic Controlling takes over.
Analysis on a single project
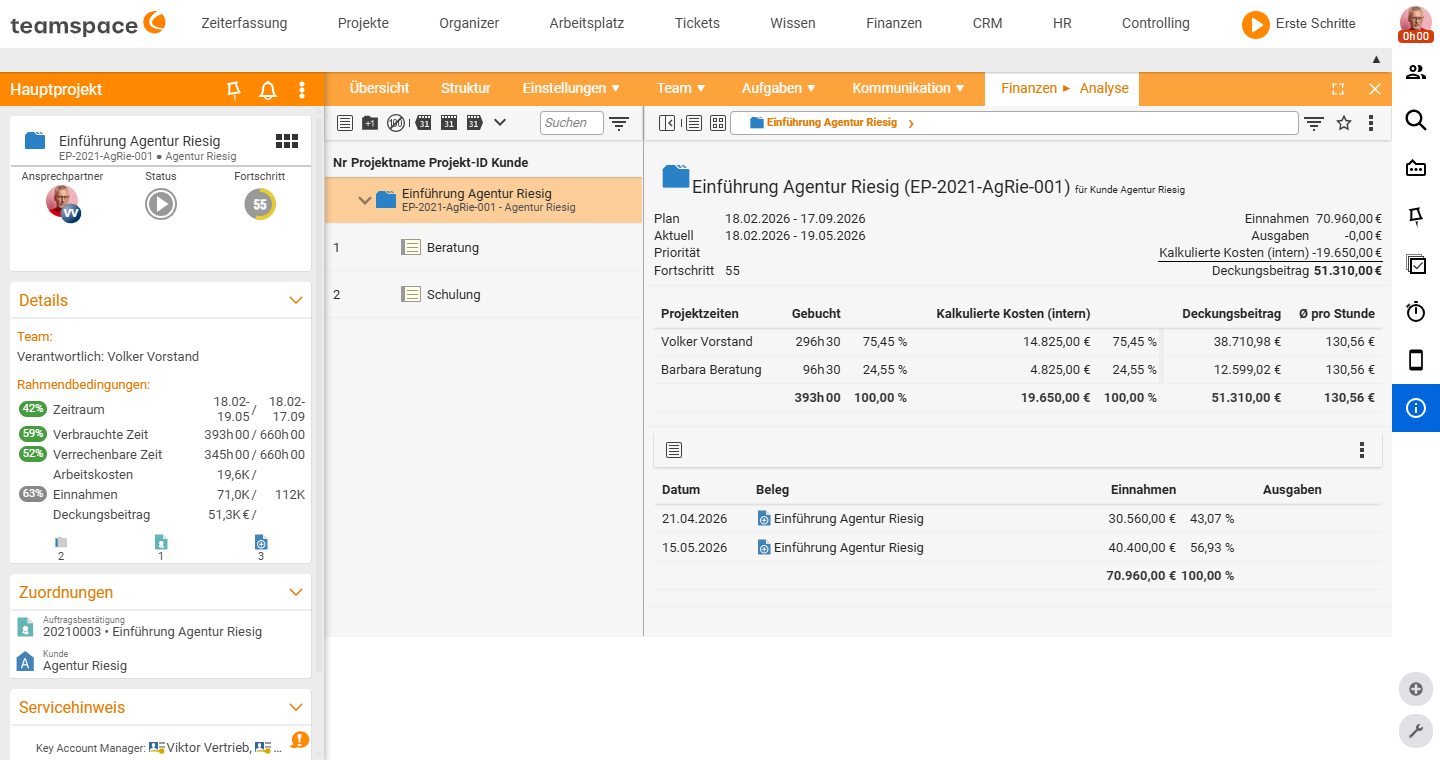
In a project’s detail manager, the “Analysis” tab bundles the commercial view:
- Income and expenditure – including travel costs and internal hourly rates.
- Staff with their time and costs.
- the project’s current contribution margin.
This lets you see at a glance whether a project is profitable.
Effort and activity
In the structure view, two tabs help with the planned/actual view:
- Activity analysis – the booked hours including their timing; ideal for tracing the real effort.
- Effort estimation – record the estimated effort; useful for quotes and for gauging the margin (profit).
You produce the classic planned/actual comparison via the column selection: show planned and actual values (budget, project time, billable time, labour costs) side by side. teamspace also reports automatically with warnings when limits are exceeded (see Run projects).
Across several projects
In the project overview you analyse the whole portfolio:
- Project types make projects comparable within their group (number per quarter/year, duration, revenue, effort).
- Project directories and the status filter structure the view (e.g. only the running projects of one branch).
How to set up this order is in Set up project types and directories.
When Controlling takes over
For deeper, cross-cutting analysis you switch to the topic Controlling. There you will find, among other things:
- project and staff reports across the entire portfolio,
- the earned-value analysis (planned costs, actual costs, earned value) with forecasts of time and cost efficiency,
- the milestone trend analysis and other key figures for business management.
Rule of thumb: If it is about one project, you find the figures directly on the project. If it is about comparing many projects or about forecasts, Controlling is the right place.
Related topics
- Project views: structure and details Project management Reference
- Set up project types and directories Project management Configuration
- Topic: Controlling Controlling
- Earned value analysis