
Three global reports show you how the team is utilised across all capacities. On top of that comes a tab within the capacity that analyses just that one. Which view suits which question depends on what you want to know.
You reach the three reports via the tiles in the Projects module modal, section Capacities and timesheets, or as separate list tabs in the module.
Capacity planning – the team at a glance
The Capacity planning report shows all employees side by side with their utilisation per week: one row per employee, the timeline in year, quarter, month and calendar week along the top, the totals on the right. The view can be switched to a day, week or month basis as needed.
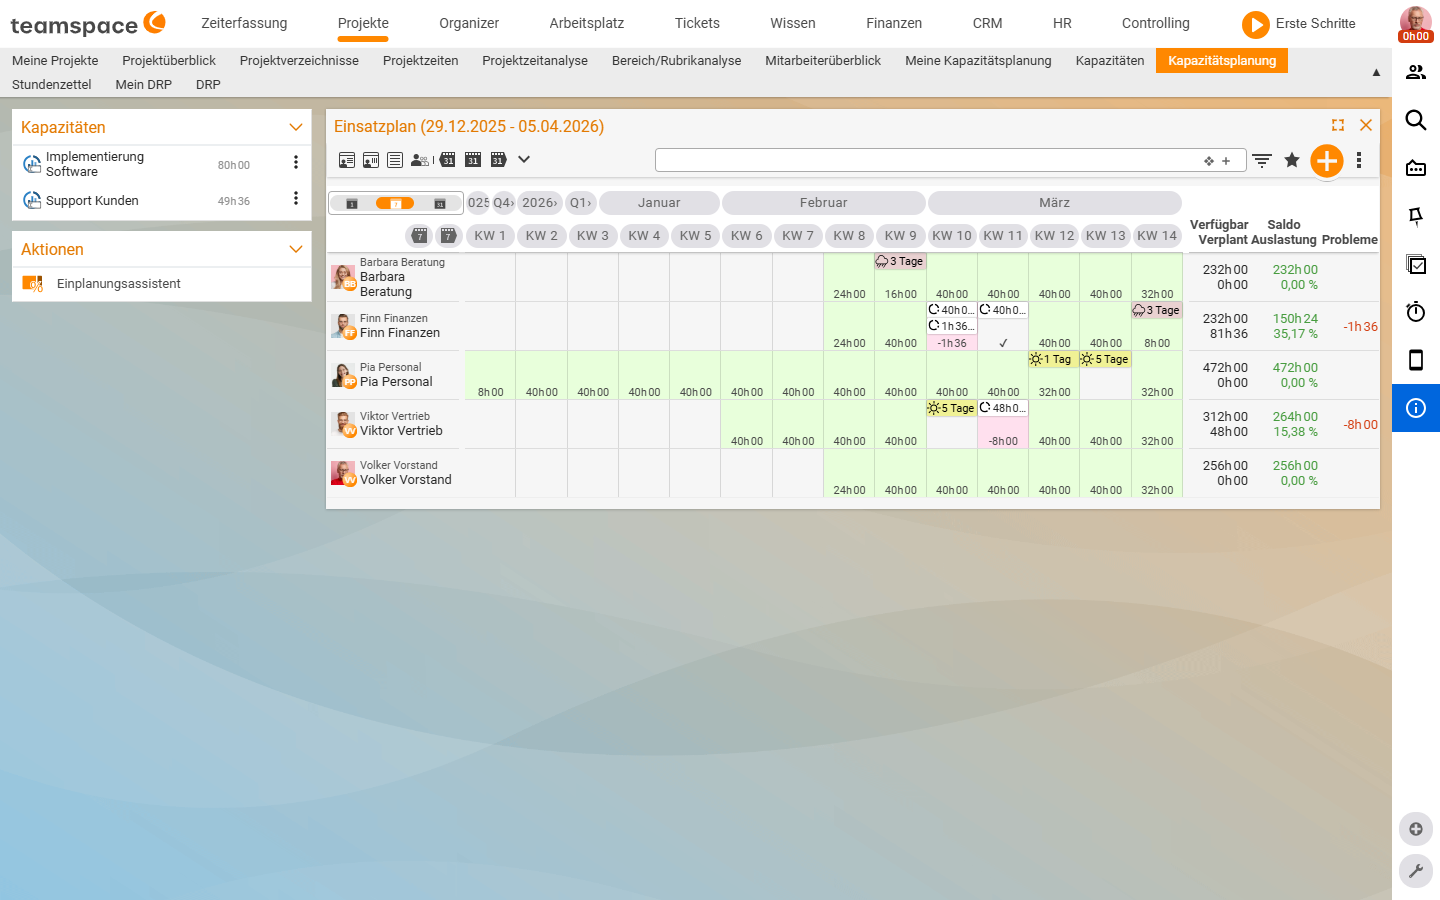
On the right you find:
Available– hours the employee could in theory work in the period.Scheduled– the sum of all hours that capacities place on them.BalanceandUtilisation– the difference and the percentage.Issues– the number of conflicts the warning system reports for the employee.
This is the place where you spot overbookings before they become a problem – for instance a red week for an employee because three projects want them at the same time.
My capacity planning – just you, at day level
The same view, but only for you – and at day level instead of week level. The timeline runs day by day, coloured by utilisation. Useful for personal weekly planning: you see at once where your full days lie, where there is buffer and whether the next quote even fits in.
Employee overview – utilisation over time
The Employee overview report is a graphical overview of utilisation over time. It bundles booked and planned activities with holidays and sick leave in a single display – the quick answer to “who was busy and when?”
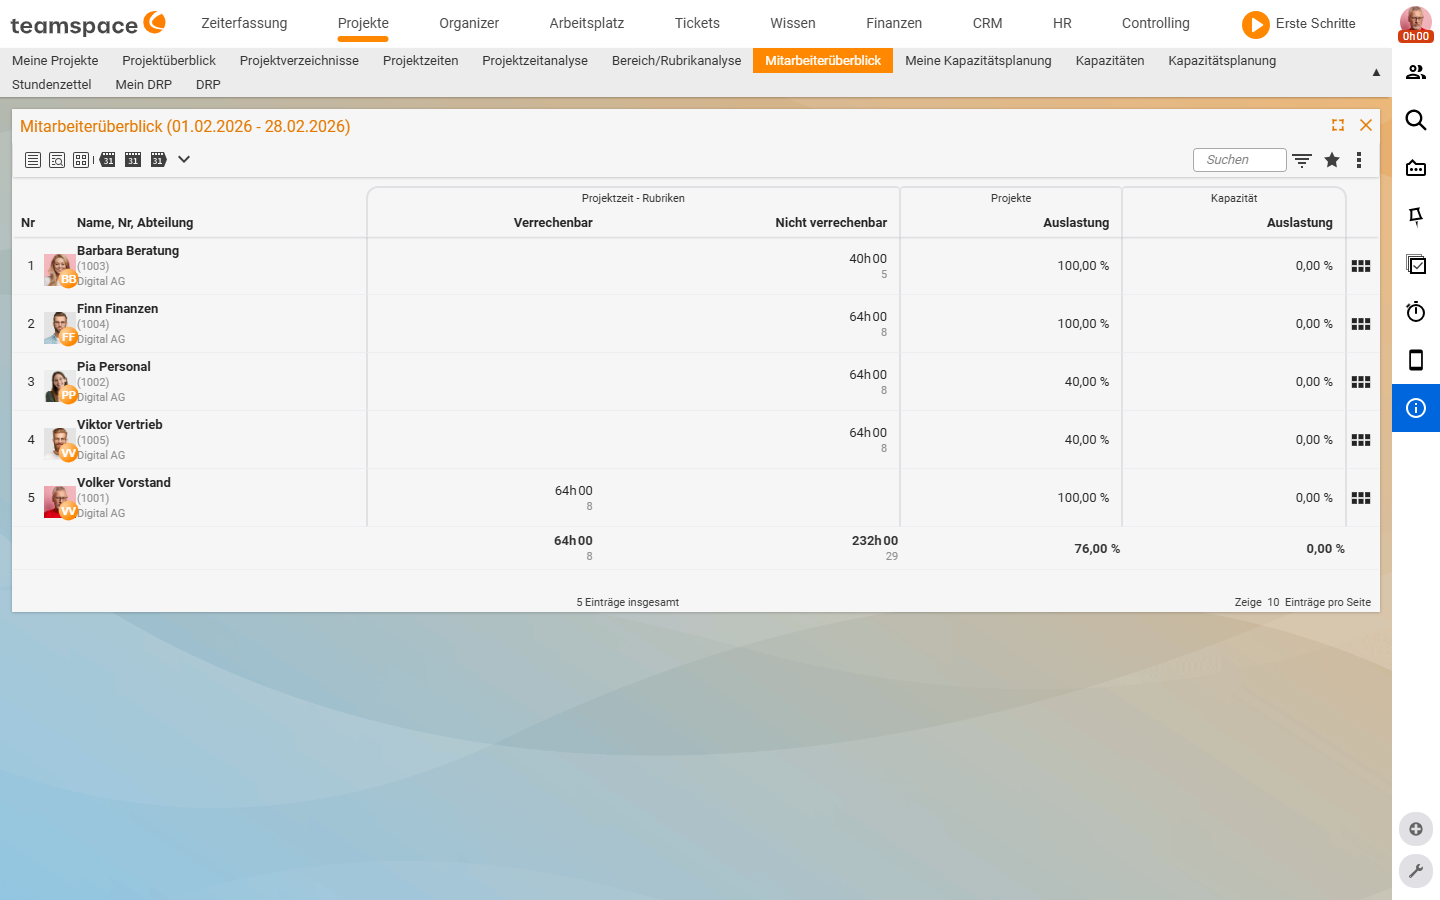
For each employee the report shows:
Name,No,Department– the identification.Project timeas the dual headingBillableandNon-billable– what was spent on customer projects and what was internal.Projects utilisation(%) – how utilised the employee is across all projects.Capacity utilisation(%) – how utilised they are across the planned capacities.
A detail view per employee shows the distribution across individual projects – useful when you want to trace who had how much time where.
The Capacity analysis tab – an individual capacity
When you want to analyse a single capacity, you go into the detail manager and open the Capacity analysis tab. The table shows employees in rows, calendar weeks in columns, plus the Time (plan) and Time (booking) columns. You see where plan and booking diverge.
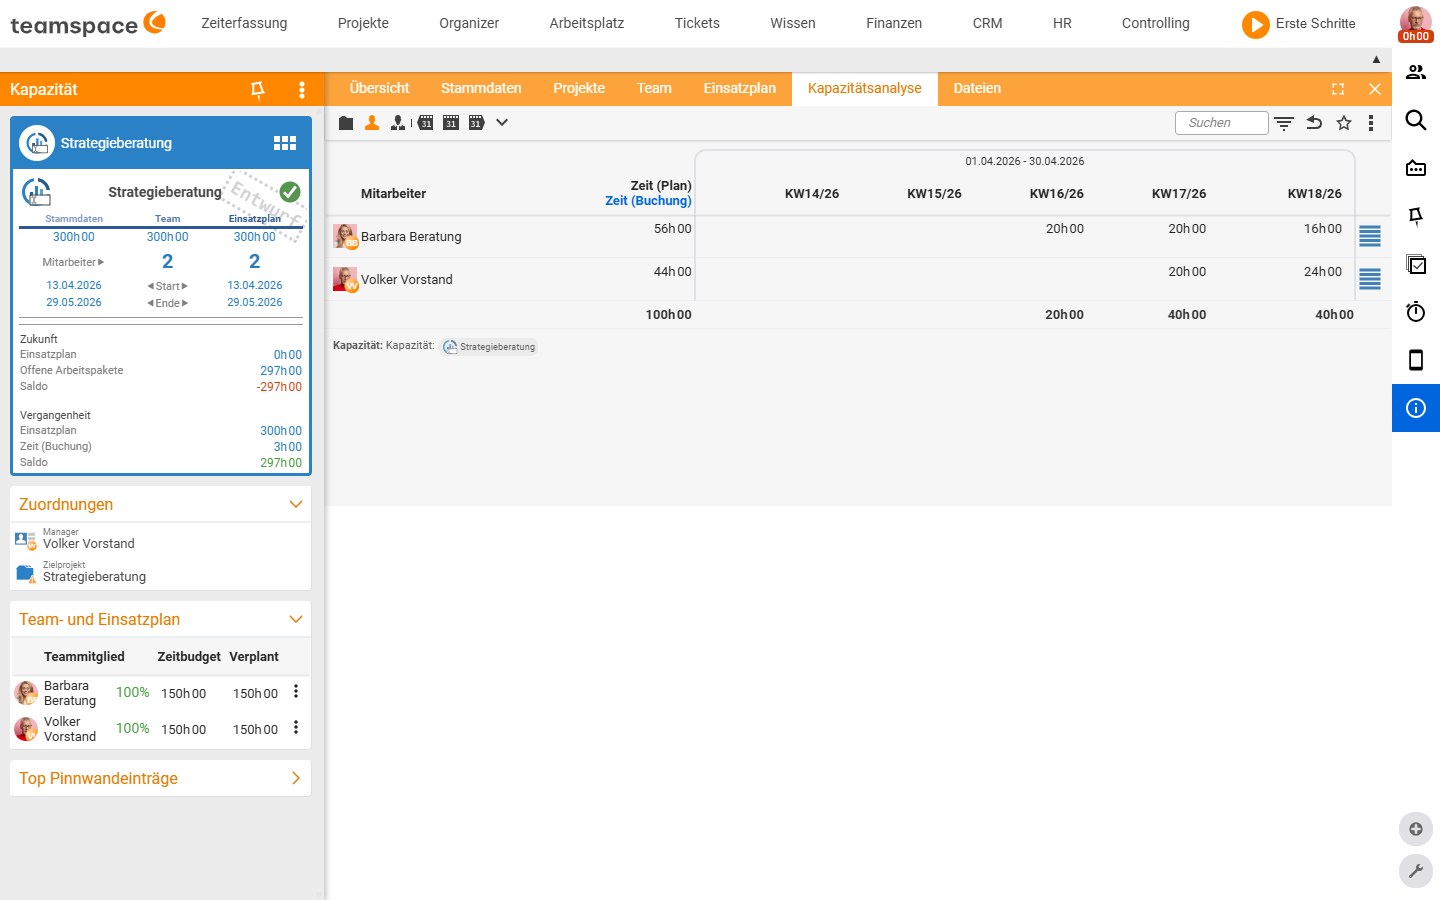
Via the toggle icons at the top you regroup the same data – by project, employee or organisation. The capacities are shown over time.
The tab is especially valuable for capacities with a forecast revenue (Forecast revenue (per hour) in the master data): multiplied by the planned hours it produces a revenue preview – you see not just hours, but money.
Which view for what?
| You want to … | How to |
|---|---|
| Spot overbookings across the whole team early | Report Capacity planning, read the Utilisation and Issues columns. |
| Plan your own week to the day | Report My capacity planning (day level). |
| See who was busy and when (plan + actuals) | Report Employee overview. |
| Separate billable from internal time | In the Employee overview, the dual heading Billable / Non-billable. |
| Compare plan and booking of a capacity | The capacity’s Capacity analysis tab, columns Time (plan) / Time (booking). |
| See the planned revenue of a capacity | Set Forecast revenue (per hour), then the Capacity analysis tab. |
| Group the analysis by project instead of employee | The toggle icons in the Capacity analysis tab (project / employee / organisation). |
| Be alerted to deviations automatically | Activate the warning system – see Set up the warning system. |
Notes
- The plan-versus-actuals reconciliation requires booked times from time tracking – see Topic: Time tracking.
- A project-related capacity analysis as a controlling report is also available under Topic: Controlling.
Related topics
- Set up the warning system Capacity Configuration
- Maintain the resource schedule Capacity How-to
- Topic: Controlling Controlling How-to