
You analyse your pipeline through several views in the CRM: the Sales opportunities list shows each opportunity individually with its key figures, Sales opportunity analysis aggregates by stage and CRM status, and the CRM analysis places the sales activities over time. Each view answers a different question.
Sales opportunities – the individual view
The Sales opportunities tab opens the full list of all opportunities. The list header reads Sales opportunities (No time filter) – by default you see everything, regardless of date. The columns are stacked per cell (top/bottom) and cover, per row:
NoandAccount manager– the running number and the responsible member of staff with their avatar.Name/Date– the name of the opportunity and the creation or change date.Organisation/Contact– the assigned customer.Sales stage/Probability– where the opportunity sits in the funnel and how certain it is.Change date/Current value– when something last happened and the projected value.Revenue start/Target value– when the money is expected and the target order value.
In the left sidebar is the Summary block with the filters All, New today, Last week and Critical (each with a count). Below it the Statistics of filtered values block expands – it aggregates the filtered list per stage and per account manager.
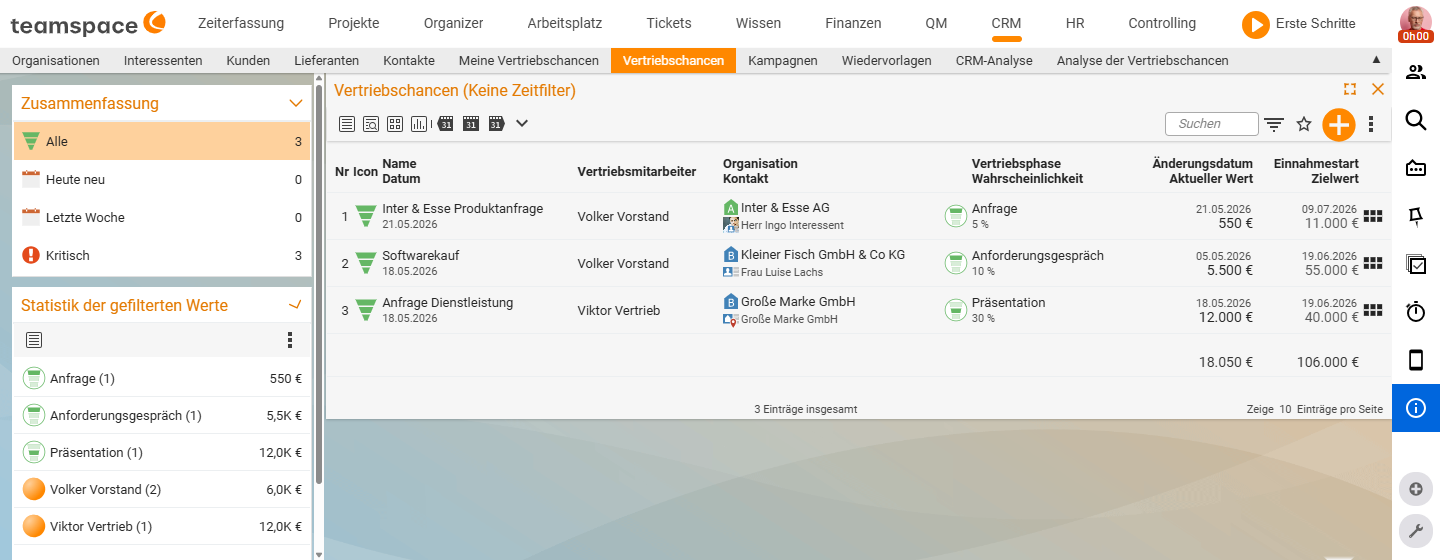
In an example sandbox the aggregate reads like this:
Enquiry (1)—€550Requirements meeting (1)—€5.5KPresentation (1)—€12.0KVolker Vorstand (2)—€6.0KViktor Vertrieb (1)—€12.0K
At a glance: three opportunities across three stages, two with Volker and one with Viktor – a total pipeline of €18,050. You use this tab when you want to check the maintenance state of individual opportunities or see, at staff level, who carries how much pipeline.
My sales opportunities is the identical list, only filtered to the opportunities where you are recorded as the Account manager – ideal for reading your own funnel.
Sales opportunity analysis – the pipeline broken down
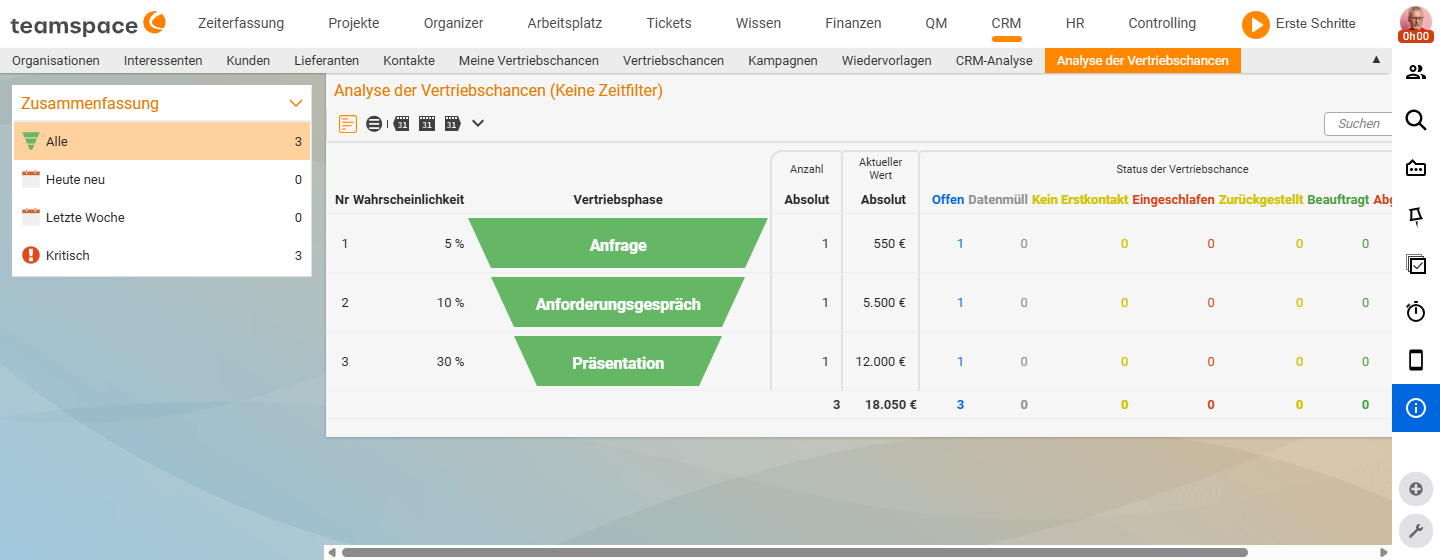
The Sales opportunity analysis tab turns the view around. Instead of one row per opportunity you see one row per stage – and each stage is split by CRM status. You reach it in the Bookmarks area through the Sales opportunity analysis tile in the Controlling section; the tile’s subtitle reads Sales funnel analysis of departments and account managers.
The columns:
No,Probability,Sales stage– the step in the funnel, shown as a green funnel stone, with the probability to its left.Absolute count/Absolute current value– how many opportunities sit in the stage and what monetary value is behind it.Status of the sales opportunity– a sub-column perCRM status(Open,Junk data,No initial contact,Dormant,On hold,Ordered,Rejected).
The footer holds the sum across all stages. With this, the list answers three questions at once: where is most of the money in the funnel? Where are you losing opportunities (the Rejected column)? And where do they sit untouched (Dormant, On hold)?
CRM analysis – activities over time
The CRM analysis does not analyse opportunities but the CRM activities attached to opportunities, organisations and contacts. The list header carries a period (CRM analysis (<DD/MM/YYYY> - <DD/MM/YYYY>)); the columns show Activity type and Count, then one column per calendar week (CW15/26, CW16/26 …). This is how you read off how many calls, meetings or quotes happened each week – your sales momentum over time. Patchy weeks are a warning sign: not a problem yet, but too little activity to turn into orders later.
The CRM analysis and further analyses (customer analysis, contribution margin) are described in detail in the CRM topic – see CRM reports and analyses.
Who sees which opportunities
The lists filter not only by stage and status but also by the permission model. If you are recorded as the Account manager on an opportunity, it appears in My sales opportunities regardless of the filter. Which other people’s opportunities you see in the full list depends on the permission model. There is no separate Sales team list in the CRM bookmarks area – the visibility of other people’s opportunities is governed solely by the permission model.
Common questions & needs
| You want to … | How to |
|---|---|
| See the total value of your pipeline | Sales opportunities tab → expand the Statistics of filtered values sidebar (aggregate per stage/staff member). |
| Only your own opportunities | Open the My sales opportunities tile. |
| See which stage holds the most money | Sales opportunity analysis tab → Absolute current value column per stage. |
| Spot lost opportunities | In the Sales opportunity analysis, read the Rejected sub-column. |
| Find stalled opportunities | The Dormant and On hold sub-columns of the Sales opportunity analysis. |
| Check weekly sales activity | Open the CRM analysis – activities per calendar week; details in CRM reports. |
| Only opportunities from a period | In the Summary sidebar choose New today or Last week – for fixed periods use the list’s period bar (This month, This year …). |